Showing posts with label drinking water. Show all posts

Sunday, October 30, 2022

Water Rates in the DMV Area

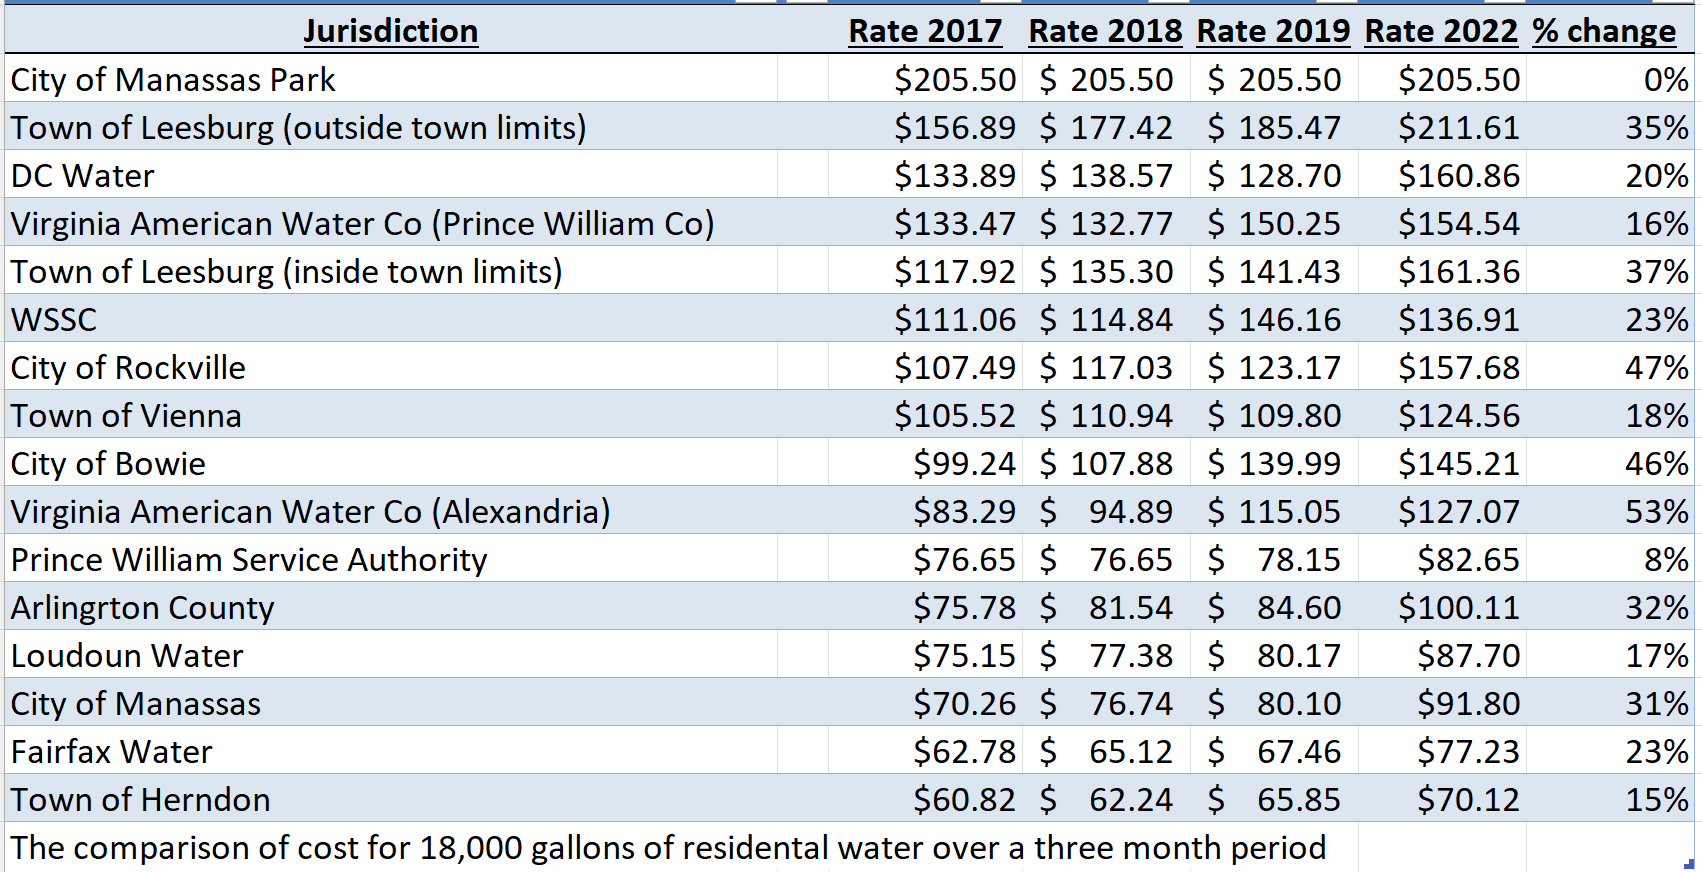
With the notable exception of Manassas Park,  water bills in our region have  been increasing. Manassas Park has finally surrendered its title of most expensive water in the region to the Town of Leesburg.

There is no true “cost” of water, the price charged for water, often does not reflect its value or true cost.  WSSC has been struggling to raise rates and increase revenue, even as water usage per person fall,  to pay for a decades long repair and restoration of their water and sewer distribution system. They are currently engaged in a 10 year program to replace over 2,000 miles of water pipe and similar amount or sewer pipes. WSSC needs to fund both ongoing operations and the billions of dollars in capital needed to rehabilitate, upgrade and replace water and wastewater infrastructure.

Recently, Fairfax Water announced its intention to raise their water rates next spring as they do almost every winter. There will be, as usual, a public hearing on Thursday, December 15, 2022, on the proposed rate increase held at Fairfax Water’s main office at 8570 Executive Park Avenue in Fairfax. This rate increase is part of their ongoing program to ensure that the water infrastructure in Fairfax County is maintained. The proposed rate increase will go into effect April 1. 2023. Visit Fairfaxwater.org/rates for a complete list of rate and fee increases.

The need for infrastructure replacement is an issue that has caused significant service problems and rate increases in other parts of the Washington Metropolitan region. Fairfax Water Board of Directors have dedicated funding to infrastructure maintenance and replacement for many years, and has forecast future capital needs for replacing water mains in the system. The Town of Leesburg did not have a capital program in place. 

Every time they propose to raise water rates, Fairfax Water performs a comparison of the water costs throughout the Washington Metropolitan region. I have tracked this information (with exception of Pandemic years) above. This comparison is based on rates as of July 1, 2022 (and July 1, 2017, 2018, 2019) and on 18,000 gallons of residential water use for an established account over a three-month period. As you can see above even with this increase, Fairfax Water’s commodity rates will remain among the lowest in the Washington metropolitan region.  Fairfax Water sells water to Prince William Service Authority, American Water, Manassas Park and others.

Sunday, June 5, 2022

Water In Eastern Prince William County

There was a Town Hall meeting held at Jenkins Elementary School on Thursday, June 2nd  2022 about the changes planned in land us in the Comprehensive Plan Update and Amendments and what the impact will be on Prince William County. Below is my talk:

If you live in the eastern portion of Prince William County you should care very much about the fate of the Rural Crescent because the Rural Crescent is about water, your water. The public water supply in eastern Prince William (blue) comes from the Occoquan Reservoir. PWSA purchases 15 million gallons of water a day from Fairfax Water for you- it is all drawn from the Occoquan Reservoir. 


The Rural Crescent allows rain water to flow gently over vegetation, feed the aquifers that provide water to the private wells and the Evergreen water system, but also feeds the tributaries to Bull Run and the Occoquan River assuring the base flow to the rivers and streams that feed the Reservoir.

Development will impair the recharge of the groundwater aquifer, but also increase sediment and salt flow into the Occoquan Reservoir, reduce stream flow and deteriorate water quality while increasing demand for water to feed more homes, businesses and data centers.


Development increases impervious cover from roads, pavement and buildings does two things. It reduces the open area for rain and snow to seep into the ground and percolate into the groundwater and the impervious surfaces cause stormwater velocity to increase preventing water from having enough time to percolate into the earth, increasing storm flooding and preventing recharge of groundwater from occurring. According to the EPA groundwater recharge is reduced from 50% to about 15% and runoff increases from around 10% to 55%.


When generally open rural area is developed stormwater runoff increases in quantity and velocity washing away stream banks, flooding roads and buildings, carrying fertilizers, oil, grease, and road salt to the Occoquan Reservoir. The salt level in the Occoquan Reservoir is rising almost to the critical point, Fairfax Water says it will cost $1-$2 billion to build desalination treatment their plants.


Our future and our children’s future is our water. We can’t allow it to be destroyed by paving roads and building data centers, warehouses and housing developments that will produce windfall profits for the landowners while leaving us with the bill of one to two  billion dollars to remove the increasing salt level from the Occoquan Waters.

Wednesday, March 16, 2022

Spring- Time to Flush the Pipes

 As part of the annual maintenance program for the regional water distribution systems in Virginia and Washington DC, on March 21st , 2022 Fairfax Water, the Washington Aqueduct, Loudoun Water and the City of Manassas will switch from chloramine to chlorine to disinfect their water. During this time, Arlington Department of Environmental Services, DC Water, the Prince William Service Authority, Loudoun Water and Fairfax Water will begin flushing their water distribution systems. Each spring these water distribution companies flush their water mains by opening fire hydrants and allowing them to flow freely for a short period of time.


Fairfax Water will disinfect with chlorine from March 21st  to June 13th and the water systems the flushing of the water mains in Fairfax and Prince William will occur during that time. Crews from the Service Authority and Fairfax Water will open hydrants throughout their service area in brief intervals in order to draw water more forcefully through the distribution system and scrub out the pipes. This helps to dislodge sediment that may have collected in water mains over the past year. In DC, Arlington and  Falls Church, the flushing will occur from March 23 through May 9th , 2022. Those jurisdictions purchase treated drinking water from the Washington Aqueduct. Loudoun Water also announced they will be starting their program on March 21st.


For most of the year, chloramines, also known as combined chlorine, is added to the water as the primary disinfectant. During the spring the water treatment plants for Fairfax Water, Loudoun Water and the Washington Aqueduct switch back to chlorine in an uncombined state, commonly referred to as free chlorine. This free chlorine reacts with sediments suspended during flushing and kills bacteria that may be in the bio-film that forms on the pipe walls. Many water chemistry experts believe this short exposure to a different type of disinfectant maintains a low microbial growth in the bio-film and improves the quality and safety of the water.

This change in disinfection is an annual program to clean the water distribution pipes and maintain high water quality throughout the year. The U.S. Army Corps of Engineers Washington Aqueduct provides water to the District of Columbia, Arlington County, and other areas in Virginia. Fairfax Water provides water to Fairfax County and parts of both Loudoun and Prince William County. WSSC does not switch their disinfectant.

You may notice a slight chlorine taste and smell in your drinking water during this time, this is not harmful and the water remains safe to drink. Depending on your location within the distribution system, it could take up to a week for your drinking water to transition from combined to free chlorine at the beginning of the flushing program, or from free chlorine to combined chlorine at the conclusion of the flushing program. You may want to use filtered water to drink or leave an open container of water in the refrigerator for a couple of hours to allow the smell to dissipate. Refrigerator filters remove chlorine so you do not have to worry about ice. Water customers who normally take special precautions to remove chloramine from tap water, such as dialysis centers, medical facilities and aquarium owners, should continue to take the same precautions during the temporary switch to chlorine. Most methods for removing chloramine from tap water are effective in removing chlorine. The annual chlorination is important step to remove residue from the water distribution system. Free chlorine is better suited to remove residue that may have collected in the pipes than chloramine and a coordinated opening of fire hydrants serves to flush the system and scrub the pipes.

Sunday, December 12, 2021

Increasing Salinization of our Drinking Water

According to the Izaak Walton League of America in Virginia: “The data collected by Virginia Save Our Streams volunteers shows, without a doubt, that urbanization and development have had a significant impact on the water quality of streams in Virginia. Impervious surfaces like roads and roofs drive tremendous amounts of polluted runoff into gutters, storm drains, streams, and rivers. This water runs untreated into critical sources of drinking water like the Potomac River and reservoirs. Although this water will be treated before it enters people’s homes, some chemical pollutants are difficult to remove.”

One of those pollutants is chloride from sodium chloride. Analyses from three different studies at multiple locations have found increasing freshwater salinization in Northern Virginia. Chloride salts dissolve easily in water. High concentrations can impede the ability of freshwater animals (including humans) and plants to control their water and salt content (osmoregulation) and certainly affects taste. Concentrations in the Potomac River have risen almost 10 fold since 1940. The rise is especially noticeable since 2000 in winter months, where average concentrations have increased to 37.8 mg/L in the 2010s.

from ICPRB the increasing blue and green show the increasing Cl concentrations

Road salting during snow and ice storms is now considered the largest source of chlorides to the Potomac and its tributaries in the Washington, D.C. region (e.g., Porter et al. 2020). Concentrations are also rising in the other three seasons. According to the Interstate Commission on the Potomac River Basin (ICPRB) this may indicate that groundwater is holding chlorides deposited during winter and slowly releasing them to the river as baseflow during drier months. Evaporation from the river surface during warm weather could also concentrate chloride in the water.

Salts are very effective at deicing roads; however, after application, the salts are washed off into local waterways or seep through soils into groundwater systems with negative impacts on water quality and the environment. Salts pollute drinking water sources and are very costly to remove. The only available technology to remove salt from the source water is reverse osmosis which is extremely costly and requires a significant amount of energy to run.   

Weathering of rocks and sediment, natural sources of chloride in rivers, contribute to the problem but high concentrations  come from winter road salting, fertilizer runoff, water softeners and oil and gas production. Due to their corrosive nature, salts also increase the costs of maintenance, repair, and replacement of infrastructure like roads, sidewalks, driveways, bridges, and pipes which are subject to stress cracking. Improved management and use of salts during winter weather events can maintain public safety and hopefully minimize the negative impacts of salty runoff. However, adding more paved surfaces to treat increases the challenge. Despite VDOT efforts to brine the roads, the salt level in the Occoquan Reservoir continues to rise. 


The ICPRB has been working with the Virginia Department of Environmental Quality (VDEQ) and the Northern Virginia Regional Commission to decrease salt levels in area streams, hoping to prevent the need to invest billions of dollars in desalination equipment in the region’s water treatment plants. The plan is to implement a voluntary management of the use of salts for roadways and walkways through the implementation of the Salt Management Strategy just published by the ICPRB and VDEQ. The central purpose of the Salt Management Strategy is to try and reverse the trend of increasing salt levels and reduce the amount of salt in area waters to ensure protection of aquatic life and drinking water while continuing to maintain public safety and accessibility during the winter. 

Sunday, December 5, 2021

ICPRB Needs to Model Toxic Algae Blooms

Each summer for the past few years, toxic blue green algae has been found in in our region. The problem appears to be growing worse. This past summer the Virginia Department of Health issued a Harmful Algae Bloom (HAB) Advisory for a 53-mile stretch of the North Fork of the Shenandoah River in August. Samples taken from algal mats on the river bottom contained harmful levels of toxins produced by cyanobacteria. Other areas of Virginia reported non-toxic algae blooms and there were several crowd sourced reports of algae in August.

Algae blooms also called harmful algal bloom (HAB) or dead zones form in summers when higher temperatures reduce the oxygen holding capacity of the water, the air is still and especially in years of heavy rains that carry excess nutrient pollution from cities, suburban lawns and farms. The excess nutrient pollution combined with mild weather encourages the explosive growth of algae fed by excessive nutrient pollution. However, toxic algal blooms are relatively new.

Not all algal blooms are toxic or hazardous. Only the certain species of blue-green algae form the toxin, for reasons that aren't fully understood. Toxic bacteria were not a problem until the 21st century, though algae blooms have been a problem on Lake Erie, the Gulf of Mexico, the Chesapeake Bay and other areas for over half a century. Only algae that contains microcystine or cyanobacteria, a toxin produced by microcystis, a type of blue-green algae that spreads in the summer are hazardous. In 2014 routine water testing in Toledo, Ohio found two samples that tested positive for microcystin at concentrations higher than the VDH advisory level of 1 microgram per liter for potable water. This shut down their water supply for days.

In the 21st century toxic or hazardous algal blooms have become a concern in our region. They occur when algae grow out of control when there are favorable environmental conditions. Hazardous algal blooms, the ones that contain the toxins, can lead to the poisoning of fish, shellfish, birds, livestock, domestic pets and other aquatic organisms that can lead to human health impact from eating fish or shellfish exposed to toxins as well as drinking water contaminated by toxins. Our existing water treatment plants do not remove the toxins and toxic algal blooms could disrupt water supply in our region.

This past summer in mid-July the Virginia Department of Environmental Quality (DEQ) found extensive multi-species benthic algal mats in the North Fork Shenandoah River. Analysis found that the mats contained several cyanobacteria and high levels of cyanotoxins. Tropical Storm Ida came through the North Fork Shenandoah River watershed on September 2, 2021, with severe winds and dumping almost 4 inches of rain on parts of the watershed sharply raising river flow rates.

Anticipating the storm’s potential to scour the algal mats from the river and wash them downstream, the Interstate Commission on the Potomac River (ICPRB) ran its emergency spill model to attempt to track the algae as it was carried downstream by storm flows. The ICPRB then implemented sampling to determine if measurable algal toxin levels reached the Potomac River mainstem after the storm. Samples were collected near the mouth of the Shenandoah River when their models indicated the scoured North Fork algal material would be passing.

The North Fork Shenandoah River is the raw water source for several towns including Woodstock, Strasburg, and Winchester, VA. Two toxins were detected in raw and/or finished water samples at Strasburg on August 3rd, 9th , and 12th but not detected in subsequent samples. Cylindrospermopsin was detected in one finished water sample at Strasburg on August 3rd (0.062 µg/L).

Neither toxin exceeded VDH’s advisory thresholds. Microcystin, nodularin and saxitoxin were not detected in any samples. The relatively low cyanotoxin levels in the water column and water supply intake samples suggested to the scientists at the ICPRB that the algal mats were still intact for the most part and were not releasing measurable toxins to the water column.

The Scientists believe that the North Fork algae bloom was washed out by Tropical Storm Ida before the die-off of the bacteria and release of the toxins and that the rainfall associated with the storm served to dilute the concentration of toxic bacteria. Tropical Storm Ida’s very high flows diluted the cyanotoxins in the scoured algal mats to non-detectable levels before they reached the Potomac mainstem.

However, the scientists suggest that “this might not be the case when streamflows are lower, as is more typical of late summer and early autumn, and cyanobacteria blooms are senescing. Further investigation of the downstream transport of cyanotoxins in the Potomac River and its tributaries could be done with river flow models that are more advanced than the spill model used.” While the spill model was adequate for the purposes of this rapid response sampling, the spill model is a relatively simple with built-in assumptions that cannot be changed to reflect actual river conditions. “Additional field observations and algal bloom sampling would also provide a better understanding of how rapidly cyanotoxins decompose once they are released into the water column and exposed to different river conditions.”

A new model needs to be built to reflect the behavior of the river and the cyanotixins to help prepare all the local water agencies for future toxic or hazardous algal events. With the increase in these events in our region we must be prepared for toxic bacteria impacting our regional water availability. Sadly, we need to be able to predict when toxic bacteria may force the Washington Aqueduct, WSSC, Fairfax Water and Loudoun Water to close their Potomac River intakes. Our water companies will need to be prepared with enough water storage to ride out a potential annual toxic bacteria event. Welcome to our new world.

Wednesday, December 23, 2020

EPA’s proposed Lead and Copper Rule

 In the waning days of this administration the White House is preparing to sign the U.S.EPA's first updates to the nation's lead and copper standards for drinking water rules since the lead action level was lowered. The update to the rule is seen as strengthening lead monitoring and notifications, and includes the first-ever requirement for testing of drinking water in schools and day cares. So it looks like it is a win for people.  

 Lead in drinking water is a national problem. That lead is predominately coming from the pipes. Lead does not exist in in most groundwater, rivers and lakes- the source water for most municipal and private water supplies. Instead, lead in drinking water is picked up from the pipes on its journey into a home. In older homes the water service lines delivering water from the water main in the street into each home were commonly made of lead. This practice began to fade by the 1950’s but was legal until 1988. Lead was also used to solder copper pipes together before 1988 (when the 1986 ban on lead in paint and solder went into effect). Also, until very recently (2011 Reduction of Lead in Drinking Water Act) almost all drinking water fixtures were made from brass containing up to 8% lead, even if they were sold as "lead-free." So even homes built with PVC piping in the 2000’s may have some lead in most of the faucets.

 The U.S. EPA regulation to control lead and copper in drinking water known as the Lead and Copper Rule (also referred to as the LCR) has undergone various revisions since it was first passed in 1991, but currently requires that:

  • Water utilities optimize their treatment system to control corrosion in customers plumbing;
  • Determine the tap water levels of lead and copper for customers who have lead service lines or lead-based solder in their plumbing systems;
  • Rule out the source water as the source of significant lead levels;
  • If lead levels exceed action levels (0.010 mg/L) the supplier is required to educate their customers about lead and actions they can take to reduce their exposure to lead.
  • If corrosion control treatment plan continues to fail to reduce lead below lead action level it must begin replacing the lead service lines under its ownership.
  • The cities distribution system usually stops at the property line when the homeowner or building owner becomes responsible. In some cities and communities (like Fairfax, VA) the property owner is responsible for the entire service line from the water main to the house (or other building). 

There are about 75 million homes across the country built before 1980, and are likely to contain some lead plumbing, though homes built until 2011 can contain some lead containing plumbing fixtures. That’s half of the housing. In addition, there are an estimated 7.3 million homes connected to their utility's water mains by individual lead service lines. These homes and buildings are mostly in older cities. These lead service lines are owned in part or whole by the property owner and should have been replaced decades ago. The cities distribution system usually stops at the property line when the homeowner or building owner becomes responsible. In some cities and communities (like Fairfax, VA) the property owner is responsible for the entire service line from the water main to home.

The new rule will tighten the requirements for lead service line replacement. Though the existing rule’s has a 7% replacement rate, it rarely happens because of provisions in the current rule allows partial line replacement which may make lead exposure worse.

Here are some of the changes in the update:

For Large Community Water Systems (serving >10,000 customers)

  • Lead Service Line (LSL) removal begins at 10 part per billions (ppb) versus 15 ppb.
  • More stringent sampling will better find the high lead levels that compel
  • replacement.
  • Systems must replace the entire lead service line when doing a replacement. If a customer replaces their portion the water systems must replace the water system-owned portion of a lead service line.
  • The replacement rate is reduced to 3%. However, systems will no longer be able to “test out” lines. The current rule allows system to count the line as replaced towards their 7% removal if a sample taken from an individual line is below 15 ppb — even when not replaced. This has been a major problem with the current rule.

Currently, water systems can stop the 7% removal of lead service lines if after one year or less once they are below the action level. The proposed rule requires water systems that fall under the rule’s mandatory 3% replacement program to have lead levels less than the 15 ppb action level for two years prior to ending the replacement program. In addition, water systems must make their LSL inventory publicly available, and must notify occupants of homes with LSL every year about the presence of their LSL. This is to allow neighborhood to be informed and take local action. Hopefully, these two steps will keep water systems in the program and get the lead service lines replaced

Finally, in  Small Community Water Systems (serving <10,000 customers) that select LSL replacement as their compliance option would have to replace LSLs on a schedule not to exceed 15 years if they exceed the action level.

Overall, this appears to be an improvement in the Lead and Copper rule that will better protect our inner city communities that are most impacted by lead in drinking water. However, “testing out” of replacement should be eliminated. All lead service lines should be replaced. Those of us on public water need to push to have all lead service lines in our communities replaced. After that the next step is to address the problem of lead in down well equipment.

Monday, July 13, 2020

Fairfax Water Annual Water Quality Report

Every year public water suppliers are required to issue an annual drinking water quality report to their customers before July first of the following year. In June Fairfax Water released their report which can be found in its entirety at this link. Fairfax Water owns and operates the James J. Corbalis Jr. and the Frederick P. Griffith Jr. treatment plants. These plants are the primary source of water for most of Fairfax County and portions of Loudoun county and Prince William County. Fairfax Water acquired the City of Falls Church water distribution system (the green areas) as well as a tiny area (orange area) that serve approximately 120,000 people and obtain their water from the Dalecarlia and McMillan treatment plants, part of the Washington Aqueduct which is owned and operated by the U.S. Army Corps of Engineers.


The result is that now Fairfax Water provides water to county residents from their two water treatment plants and buy water from the Washington Aqueduct to supply residents in and around the City of Falls Church. These were historic systems that were once town owned. The newer developments around Merrifield and the Dunn Loring Metro Station are supplied water from the Fairfax Water owned plants. Thus, they are required to report on the water quality of all these sources. 

Both the Washington Aqueduct and Fairfax Water run excellent water treatment plants. All four plants use advanced technologies and practices in drinking-water treatment, which is the process of cleaning raw water to make it safe to drink. Fairfax Water reports that their water consistently surpasses all federal (US EPA Safe Drinking Water Act) and state standards. Of the 182 compounds that are required to be tested for, very few were found in the finished drinking water. Those found were in concentrations well below the EPA’s maximum contaminant levels under the Safe Drinking Water Act. Fairfax Water’s state-certified Water Quality Laboratory performs or manages the testing required by federal and state regulations. The Washington Aqueduct does the testing for the water they supply. 

Over the years as the county grew Fairfax Water expanded its infrastructure. They built the Frederick P. Griffith Jr. Treatment Plant first and then the James J. Corbalis Jr. plant and expanded their distribution system which today serves over 1.7 million people with the lowest water rates in the region.

In order to ensure that tap water is safe to drink, the EPA limits the amount of certain contaminants (a list of more than 90 contaminants) that can be in the water provided by public water systems under the Safe Drinking Water Act. When untreated water enters the treatment plants, coagulants are added to cause small particles to adhere to one another and settle in a sedimentation basin. The water is then filtered through activated carbon and sand to remove remaining fine particles. This produces water with extremely low turbidity and provides excellent barrier against pathogens such as Cryptosporidium and Giardia. 

Next, the water is disinfected with chlorine to kill harmful bacteria and viruses. A corrosion inhibitor is added to help prevent leaching of lead and copper that might be in household plumbing (Fairfax Water reports that all lead containing service laterals were removed from the system). Fluoride is added to protect teeth. Powdered activated carbon and potassium permanganate may also be added to the treatment process to remove taste or odor-causing compounds. In addition to these treatment steps, the Corbalis and Griffith plants use ozone to further reduce odors and organic material. Fairfax Water’s state-certified Water Quality Laboratory performs or manages the testing required by federal and state regulations. The Washington Aqueduct does the testing for the water they supply.

Fairfax Water and the Washington Aqueduct continually monitor and test the water during the treatment process and the finished drinking water as it leaves the plant and in customer homes a part of the Lead and Copper Rule testing. The Virginia Department of Health performs, source-water assessments for the watersheds. The assessment consists of maps of the evaluated watershed area, an inventory of known land-use activities, and documentation of any known source-water contamination within the last five years. Based on the criteria developed by the VDH, the Potomac River and the Occoquan Reservoir were determined to be of high susceptibility to contamination.

Nonetheless, the quality of the finished drinking water being produced at Washington Aqueduct and Fairfax Water is excellent. It meets or exceeds all United States Environmental Protection Agency (US EPA) standards and requirements. The water quality report released in June covers the sampling done during calendar year 2019. There were no violations of the U.S. EPA’s Safe Drinking Water Act. The full report is at this link

Thursday, April 26, 2018

EPA Grants $1.9 Million to Virginia Tech

Yesterday, the U.S. Environmental Protection Agency (EPA) awarded $1,981,500 to Virginia Polytechnic Institute and State University (Virginia Tech) in Blacksburg, Va., to research lead in drinking water. Virginia Tech will use this funding to create a public assisted framework to detect and control lead in drinking water, working collaboratively with the public, encouraging citizen scientists to participate in the research.

Lead in drinking water is a national problem, and according to EPA Administrator Scott Pruitt it is one of the greatest environmental threats we face as a country, especially dangerous for our children. Flint Michigan was not an aberration nor was it the worst incidence of lead in drinking water supplies. Flint became famous for their lead problem because of a combination of determined residents, blatant misrepresentation by public officials, and the good luck of engaging Professor Marc Edwards of Virginia Tech. This allowed Flint to become the poster child for lead in drinking water that Washington DC failed to become ten years earlier. Last year in an examination of data, Reuters found 3,000 communities that had recently recorded lead levels at least double those in Flint during the peak of that city’s contamination crisis. Now, according to EPA Virginia Tech's research will move us one step closer to eradicating lead in drinking water.”

Lead does not exist in in most groundwater, rivers and lakes- the source water for most municipal and private water supplies. Instead, lead in drinking water is picked up from the pipes on its journey into a home. In older homes the water service lines delivering water from the water main in the street into each home were commonly made of lead. This practice began to fade by the 1950’s but was legal until 1988. Lead was also used to solder copper pipes together before 1988 (when the 1986 ban on lead in paint and solder went into effect). Also until very recently (2011 Reduction of Lead in Drinking Water Act) almost all drinking water fixtures were made from brass containing up to 8% lead, even if they carry a plated veneer of chrome, nickel or brushed aluminum and were sold as "lead-free." So even homes built with PVC piping in the 2000’s may have some lead in most of the faucets.

The nation’s water infrastructure the pipes, treatment plants and other critical components that deliver drinking water have grown old. In many of our cities water pipes installed when systems were built have only been replaced when they break. The building service lines that connect homes and businesses to the water mains are often the original lines. For decades instead of replacing lead pipes urban water companies have used chemicals to control lead and other chemicals from leaching into the water supply.

Many at the American Water Works Association and other scientists have questioned the wisdom of this strategy. Even when successful there is always some lead leaching into the drinking water. Many of us believe that there is no safe level of lead in drinking water. No amount of exposure to lead is safe. Our national goal is to eliminate exposure to lead especially for children, who are both more susceptible to lead poisoning and suffer more severe impacts. Even at very low levels once considered safe, lead can cause serious, irreversible damage to the developing brains and nervous systems of babies and young children.

According to Principal Investigator on the Project, Dr. Marc Edwards, “Our team will establish one of the largest citizen science engineering projects in U.S. history to help individuals and communities deal with our shared responsibility for controlling exposure to lead in drinking water through a combination of low-cost sampling, outreach, direct collaboration, and modeling,” Dr. Marc Edwards continued, “We will tap a growing ‘crowd’ of consumers who want to learn how to better protect themselves from lead, and in the process, also create new knowledge to protect others. Whether from wells or municipalities, we all consume water, and we can collectively work to reduce health risks.”

Monday, August 22, 2016

Disinfection By Products in Water

The use of chlorine, chloramines and ozone to disinfect drinking water has virtually eliminated the incidence of such waterborne diseases as typhoid, cholera, and dysentery in the United States. However, research has shown that chlorine and the other oxidizing disinfectants interact with natural organic matter present in rivers and streams and our drinking water supplies to form disinfection by-products (DBPs) that increase the incidence of cancer.

Although there are hundreds of disinfection by products that can form, the U.S. Environmental Protection Agency (EPA) only regulates 11 that were the most common when chlorine was the disinfectant of choice and were linked to health concerns. Some research done in the late 20th century indicated that certain byproducts of water disinfection are linked to increases in bladder cancer, liver, kidney, central nervous system problems, reproductive effects and linked to anemia. The EPA established maximum contaminant levels for these by products: four trihalomethanes (THMs), five haloacetic acids (HAAs), bromate, and chlorite in order to protect public health.

Strategies to control disinfectant breakdown products can be divided into three categories: Removal of disinfection byproduct precursors. Modification and optimization of the treatment and disinfection processes to limit the formation of these breakdown products. Removal of disinfectant breakdown products after formation using such filtering media as activated carbon. However, most water utilities changed their method of disinfection because it was the cheapest method to comply with EPA standards for the regulated disinfection by-products. This resulted in many water utilities moving away from chlorine disinfection to alternatives such as chloramine, chlorine dioxide, and ozone, and increased the adoption of chloramine because of its relatively lower cost. Chloramine is a combination of chlorine and ammonia.

After its introduction, it was discovered that chloramine can make drinking water more caustic that may cause an increased deterioration of old water pipes and degradation of valves and fittings. In water systems that still have lead containing pipes or components; this causes lead and other metals to leach into drinking water. This happened rather spectacularly in Washington DC in the late 1990’s. In addition, chloramine has its own breakdown products with potential health impacts.

Thought the federal government did not ban the use of lead pipes in new construction and repairs until 1986, many cities banned lead pipe use decades earlier out of health concerns. Most existing lead pipes are closer to 75-100 years old, are in the older cities of the east coast and mid-west and should have been replaced in the normal course of preventive maintenance program. Unfortunately, that is not how we operate in the United States. A few cities, including Madison, Wisconsin, and Lansing, Michigan, have taken steps to remove all of their lead pipes. Such projects can cost tens of millions of dollars and have to be paid for by either an increase in water bills, property owners or both. It was estimated by the American Water Association that there are 6.5 million lead pipes still in service in the United States while the EPA estimates that number at around 10 million. That does not even consider all the homes in America that have copper pipes with lead solder.

The 1994 amendments to the Clean Water Act Safe Drinking Water Act to regulate disinfection by-products formed when chlorine reacts with organic matter in drinking water resulted in elevated lead levels in the distribution system in Washington DC when they changed from chlorine to chloramine for disinfection. The treatment process for the Washington DC water supply was changed to add ammonia after primary disinfection to react with the remaining chlorine to prevent the formation of disinfection byproducts (haloacetic acids and trihalomethanes). The change caused a lowering of pH in the distribution system, the water became slightly more caustic than it had been, increasing the possibility of corrosion.

Shortly after the change, increasing pipe failures and levels of lead began appearing in the homes of Washington DC residents. The more caustic chloramine-treated water picked up lead from pipes and solder resulting in elevated levels and deterioration of the pipes. This is just one of the unintended consequences of the change to chloramine. Today, there are growing number of scientists who are warning that the unregulated disinfection by products from chloramine may be more problematic than the regulated ones. One of the disinfection by products of particular concern is Nitrogenous disinfection by products(N-DBPs). They are formed when nitrogen-containing compounds (fertilizers) react with certain oxidants/disinfectants especially in systems using chloramine. These N-DBPs include nitrosamines, nitriles, and hydrazine, and some of these compounds are one to two orders of magnitude more toxic than the currently regulated disinfection by products. We need to reexamine the approach we are taking for the ever increasing number of regulations with unintended consequences.

Thursday, June 30, 2016

EPA Data Finds Lead Widespread

from NRDC
On Tuesday the Natural Resources Defense Council (NRDC) released their report: “What’s in Your Water? Flint and Beyond.” This report is a review and analysis to the U.S. Environmental Protection Agency (EPA) data collected under the 1991 Lead and Copper Rule (LCR).

Since 1991 the Lead and Copper Rule has undergone various revisions, but requires that: (1) water utilities optimize their treatment system to control corrosion in customers plumbing; (2) determine the tap water levels of lead and copper for customers who have lead service lines or lead-based solder in their plumbing systems; (3) rule out the source water as the source of significant lead levels; (4) if lead levels exceed action levels (0.015 mg/L) the supplier is required to educate their customers about lead and actions they can take to reduce their exposure to lead. If a water utilities’ corrosion control treatment plan continues to fail to reduce lead below lead action level it must begin replacing the lead service lines under its ownership.

The NRDC analysis indicates that in 2015, over 18 million people were served by 5,363 community water systems in the nation that violated the Lead and Copper Rule. These violations included; failure to test customer tap water for lead in an appropriate manner, failure to control corrosion that could result in lead contamination from the distribution system or homeowner pipes, and failure to report contamination to state officials or the public. In addition, the NRDC found that in 2015, 1,110 community water systems that supply drinking water to over 3.9 million people found lead levels in excess of 15 parts per billion (ppb) in at least 10% of the homes tested. This level of lead contamination is the regulatory action level established for lead under the Lead and Copper Rule.

In most cases not action was taken. According to the data analyzed by NRDC, the EPA took formal enforcement action against only 11.2 % of the over 8,000 violations that occurred in 2015. In addition, enforcement actions were taken against less than one in five of the violations where lead concentrations exceeded 15 ppm, and penalties were sought or assessed for only 3% of violations. The EPA’s database does not list Flint Michigan among the systems in violation of the Lead and Copper Rule. In fact, Michigan’s Department of Environmental Quality (MDEQ) apparently still has not officially reported Flint to be in violation of the Lead and Copper Rule. This is characteristic of the data. The EPA itself admits that “audits and assessments have shown that violation data are substantially incomplete.” The EPA has failed our nation in its primary mission and we need to reconsider the methods we as a nation use to ensure the quality of our air and water and the protection of our lands.

The nation’s water infrastructure the pipes, treatment plants and other critical components that deliver drinking water and remove and treat waste water have grown old. In many of our cities water pipes installed when systems were built have only been replaced when they break. The building service lines that connect homes and businesses to the water mains are often the original lines.

For decades instead of replacing lead pipes urban water companies (especially in poor rust belt cities that are shrinking) have used chemicals to control lead and other chemicals from leaching into the water supply. Many at the American Water Works Association and other trade groups have questioned the wisdom of this strategy, there is always some lead leaching and many of us believe that there is no safe level of lead in drinking water. No amount of exposure to lead is safe. Our national goal is to eliminate exposure to lead especially for children, who are both more susceptible to lead poisoning and suffer more severe impacts. Even at very low levels once considered safe, lead can cause serious, irreversible damage to the developing brains and nervous systems of babies and young children. The World Health Organization (WHO) notes that “the consequences of brain injury from exposure to lead in early life are loss of intelligence, shortening of attention span and disruption of behavior.”

Historically, state and federal regulations have stressed safety, reliability and affordability of service and have looked to determine the “most technologically feasible and cost-effective” strategies to maintain water systems. This has not allowed the water distribution systems to price into their fees the costs of planned preventive maintenance and system replacement program. Worse yet many cities and towns have used the water utility revenues to supplement other city services. We have failed to maintain the infrastructure, to stay ahead of water system, equipment and pipe failure. We wait for failure before we fix it that is the wrong approach. The human and society costs as the consequences of getting every last day of use out of a pipe or piece of equipment need to be weighed against the benefit of cheap water. Prices for water will need to go up so that water treatment and distribution companies can maintain replace and upgrade their infrastructure before it fails, doing otherwise is unacceptable.

Monday, March 21, 2016

The Sweet Smell of Chlorine

On March 7th Fairfax Water and the Arlington Department of Environmental Services began flushing their water distribution systems. Each spring Fairfax Water and Arlington DES flushes its water mains by opening fire hydrants and allowing them to flow freely for a short period of time. In addition, the Washington Aqueduct and Fairfax Water temporary change how the water is disinfected.

For most of the year, chloramines, also known as combined chlorine, is added to the water as the primary disinfectant. During the spring the water treatment plants switch back to chlorine in an uncombined state, commonly referred to as free chlorine. This free chlorine reacts with sediments suspended during flushing and kills bacteria that may be in the bio-film that forms on the pipe walls. Many water chemistry experts believe this short exposure to a different type of disinfectant maintains a low microbial growth in the bio-film and improves the quality and safety of the water.

This change in disinfection is an annual program to clean the water distribution pipes and maintain high water quality throughout the year. The U.S. Army Corps of Engineers Washington Aqueduct provides water to the District of Columbia, Arlington County, and other areas in Virginia. Fairfax Water provides water to Fairfax county and parts of both Loudoun and Prince William County. Both Fairfax Water and the Aqueduct switch from chloramine to chlorine during this period that runs from March 7th to May 2nd at the Aqueduct and into June for Fairfax Water.

You may notice a slight chlorine taste and smell in your drinking water during this time, this is not harmful and the water remains safe to drink. If you are a coffee and tea lover like me, use filtered water or leave an open container of water in the refrigerator for a couple of hours to allow the smell to dissipate. Water customers who normally take special precautions to remove chloramine from tap water, such as dialysis centers, medical facilities and aquarium owners, should continue to take the same precautions during the temporary switch to chlorine. Most methods for removing chloramine from tap water are effective in removing chlorine. The annual chlorination is important step to remove residue from the water distribution system.

Flushing the water system entails sending a rapid flow of chlorinated water through the water mains. As part of the flushing program, fire hydrants are checked and operated in a coordinated pattern to help ensure their operation and adequate flushing of the system. The flushing removes sediments made up of minerals which have accumulated over time in the pipes as well as bacteria on the bio-film. An annual flushing program helps to keep fresh and clear water throughout the distribution system. Removing the residue ensures that when the water arrives in your home, it is the same high quality as when it left the water treatment plant.

Drinking water in Fairfax comes from either the Potomac River or Occoquan Reservoir. The Washington Aqueduct draws its raw water from the Potomac. This water needs to be treated to remove impurities and disinfected to kill disease causing germs such as Salmonella, Campylobacter, and norovirus. Giant screens on the water intake pipes prevent trash, debris and fish, but the water is only screened and not yet drinkable. In the water treatment plant potassium permanganate (KMnO4) is added to the water to control taste and odors, remove color, prevent biological growth within the water treatment plant, and remove iron and manganese which are naturally occurring predominantly nuisance contaminants.

Then water is pumped into a series of water chambers where the pH is adjusted by adding either caustic soda or sulfuric acid and a coagulant to remove small particles of dirt suspended in the water. The water moves through a series of mixing chambers with progressively slower mixing to allow the particles to coagulate into larger and larger particles until dirt floc is formed. Then the water is held in sedimentation basins and the floc is allowed to settle to the bottom of basins by gravity where they are removed.

The next step in the water treatment process in Fairfax is the infusing of the water with ozone gas and the first of two disinfection steps. This step is not used in every water treatment plant. Ozone is highly effective in eliminating the Cryptosporidium bacteria and other naturally occurring microorganisms present in water. Unlike ultraviolet and chlorine disinfection systems (which are still used in many locations), there is no re-growth of microbes after ozonation. Ozonation also reduces the formation of trihalomethanes (chlorine breakdown products) because of the reduction of organic materials in the water before chlorination.

The final steps in the water treatment process is the second disinfection, fluoridation and the addition of a ammonium hydroxide to adjust the pH slightly to prevent corrosion of piping and fixtures of the plumbing systems in customer homes to prevent the leaching of lead from older plumbing systems and old connector lines into water. For most of the year Fairfax Water and the Washington Aqueduct use chloramine as the final disinfection step in water treatment. However, during the spring of every year they use chlorine to disinfect and flush the delivery network. Free chlorine is better suited to remove residue that may have collected in the pipes and a coordinated opening of fire hydrants serves to flush the system.

Monday, July 27, 2015

Our DC Region's Water Problems

The ability to expand and sustain any region in the United States is directly connected to the health and sustainability of the Region’s infrastructure and water resources. The most essential of the infrastructure are the portions that are almost invisible, but nonetheless essential to the American way of life- water, sewage and power. If we fail to strengthen and maintain these systems or allow unplanned and unsustainable growth, the systems will crumble, our utilities will become unreliable and we will become like India where sewage is untreated and water arrives for the lucky an hour a day.

The water infrastructure for the Washington Metropolitan Area which provides our homes, schools, businesses and public buildings with healthy, reliable water and sanitation and plays a key role in protecting public health and restoring and maintaining the quality of our rivers and streams. There are three main types of water infrastructure: drinking water, wastewater and stormwater. The systems are all connected by the rivers and streams and the water cycle itself. For example the Upper Occoquan waste water treatment plant officially known as the UOSA Water Reclamation Plant releases its treated water into Bull Run which joins with the Occoquan River to feed the Occoquan Reservoir and supply Fairfax Water. 
  
I will begin talking about the drinking water infrastructure and supply. Regionally, the drinking water infrastructure includes surface water intakes, wells, reservoirs, water treatment plants, water storage, pumps stations, 14,500 miles of water distribution lines, control valves, 114,000 fire hydrants, and water connectors and meters. This infrastructure is owned and operated by the region’s 28 water companies and serves more than 5.3 million people.

Three water utilities, the Washington Aqueduct, the Washington Suburban Sanitary Commission (WSSC) and Fairfax Water are the primary wholesale suppliers of the regions drinking water. For example: Arlington is supplied its water from the Washington Aqueduct, Prince William purchases water from Fairfax Water etc. In addition, there are small community supply wells and it is estimated that 250,000-500,000 people obtain their water from private wells in our region. 

Regionally we recycle sewage to drinking water

The region’s three big water utilities use surface water as their primary source of drinking water supply (88%-90%). The Potomac River provides about 4 million people with water. The Occoquan Reservoir in Virginia and the Patuxent River in Maryland provide another million people with water. Water supply is not unlimited, but is adequate to meet the peak demands of the region for the short term and possibly longer if we incorporate sustainability into all aspects of our lives. There are real limits to the water that can be taken from our rivers reliably and responsibly and we need to plan within those limits. However, the water delivery system is beginning to experience more frequent failures. 
from WSSC 2015

Water is paid for by charging by the gallon. To keep water prices low even as water usage in the region peaked 30 years ago, distribution companies have often cut their investments in maintaining their distribution systems. They have priced their water to pay only for the water treatment (pay the wholesalers) and emergency repairs. The water companies chose to repair piping after it failed instead of maintaining a planned repair schedule. Those failures predominantly happen in the winter. The fluctuation in temperature is tough on water mains, especially the older ones.

DC Water is a relatively small distribution system but averages about 500 water main breaks a year and has some of the oldest pipes in the region. Yet, their capital program was for many years designed to replace the distribution over a 300 year cycle. Pipes and valves are designed to last about 80 years. Pretty much DC water was planning for the failure of the system. In the past decade the replacement cycle has been shortened to 100 years, but that is too slow a pace for the aging system and unless additional investments are made, the District will experience an increasing rate of water disruptions. 
from WSSC


WSSC reportedly has on average 600 water main breaks in January each year (the worst month) and about 50 in June. About a quarter of WSSC’s 5,600 miles of water mains in Montgomery and Prince George’s counties are over 50 years old. The WSSC is currently replacing 55 miles of water pipe each year. Fairfax Water maintains a replacement schedule to replace the entire system over 76 years.
The regions drinking water infrastructure is made up of billions of dollars of capital assets a significant portion that are buried in the ground. It takes a large annual investments to operated and preserve the water treatment and distribution system. The region’s drinking water utilities are currently making approximately $1.5 billion in capital investments each year and have operation and maintenance budgets of approximately $1.3 billion per year. This $2.8 billion spent annually is not enough to maintain 24/7 water to our homes and businesses.

Though the regions water utilities have made substantial investment to upgrade the central plants to meet regulatory standards and improve water quality, they have ignored non-regulatory driven system maintenance and improvements. A scheduled and planned replacement program would allow the coordination among infrastructure sectors when pipes are being replaced, sewage pipes could be replaced, electrical cables re-laid, roads repaired. Our water distribution system is at risk of increasing rates of failure as the water utilities face the need to replace the aging pipes and valves to maintain service.


Thursday, July 10, 2014

Turning One Environmental Disaster into Two

For over a week in the middle of last January Charleston, West Virginia and the surrounding communities were without drinking water due to contamination from a chemical leak. A former fuel storage tank that was being used to store MCHM had released about 10, 000 gallons of MCHM into the Elk River just a mile and a half up river from the water intake for the drinking water supply for Charleston. MCHM is 4-methylcyclohexylmethanol an alcohol with a licorice or mint smell at extremely low concentrations, and though there are limited studies, it is believed to have relatively low toxicity.

When the MCHM leak was first discovered the West Virginia Department of Environmental Protection, DEP, found the MCHM above ground storage tank with a hole in it sitting within an unlined concrete block containment dike. The MCHM leaked from the tank into an unlined cinderblock containment area and then into the ground through which it began leaching into the Elk River and flowing about a mile down to the Charleston West Virginia water intake for the American Water drinking water treatment plant. The drinking water plant is not designed to remove the chemical from river water, so the “finished” water had the tell tail smell. It is not reassuring to be told that it has low toxicity when you can smell chemical contamination in your drinking water.

During the cleanup by Freedom Industries, the owner of the storage tank facility, about 700 tons of Crude MCHM-mixed with wastewater and sawdust to solidify it was removed from the site. Contaminated soil was left in place. Freedom Industries brought the MCHM contaminated waste to a sanitary landfill in Hurricane West Virginia. The landfill was owned and operated by Waste Management. In February 2014, without notifying the town of Hurricane, the West Virginia DEP Division of Water and Waste Management approved a request for a “Minor Permit Modification” to allow Waste Management to accept the wastewater at their Hurricane landfill. The permit modification granted at the time would allow the landfill to accept the MCHM, water and sawdust mixture until October of 2014.

On March 12, 2014 Inspectors from the West Virginia DEP responded to “licorice” odor complaint at the landfill in Hurricane. According to the DEP it was determined that the odor was from the approved disposal of wastewater that was being transferred to the landfill. Putnam County and the city of Hurricane, West Virginia petitioned a Kanawha County circuit judge who granted a preliminary injunction blocking the DEP from allowing Waste Management to continue to dispose of the MCHM-sawdust mixture at the landfill. By the March 15th hearing, the West Virginia DEP had modified the permit once again so that the permission to accept the MCHM contaminated waste had expired.

By all accounts about 228 tons of MCHM, wastewater and sawdust mixture was buried at the Hurricane Landfill. Now Hurricane is suing Waste Management to remove the material from the landfill because they are concerned that the MCHM will leach out of the landfill into the landfill collectors that go to a waste water treatment plant that ultimately releases to a creek that feed the Kanawha River, the source of Hurricane’s drinking water supply. The waste water treatment plant is not designed to remove MCHM from the leachate. The rest of the 700 tons of MCHM contaminated material from the original Freedom Industries site was ultimately disposed of at a hazardous waste disposal well in Vickery, Ohio.

Waste Management wants the case dismissed on a technicality and because the MCHM sawdust mixture does not meet the definition of hazardous waste under the Federal Resource Conservation and Recovery Act and the disposal was done under permit.

MCHM will continue to appear in the Charleston drinking water as it continues to leach into the Elk River from the contaminated soil that remains at that site. A month after the first incident in Charleston, MCHM was once more detected in the cities’ water supply and forced a closing of Charleston schools. Now Hurricane, West Virginia is waiting for MCHM to appear in their drinking water supply.

These rivers are the source of the drinking water supplies for over 300,000 people, old, young, healthy, sick, and pregnant- the entire spectrum. Now, there is the potential that both communities with have their drinking water impacted by chronic long term extremely low level exposure to MCHM for years. These were absolutely the wrong decisions. Public concern is very real, whether or not the MCHM mixture meets the definition of hazardous waste. That sawdust mixture should have been incinerated for a permanent solution and the tank or tanks should have been removed from the Freedom Industries site and along with all the contaminated soil to be remediated at a different site away from a drinking water supply. Moving contamination from one site to another is not remediation. Incineration, remediation or disposal at a hazardous waste disposal site would have been far more appropriate than using the town sanitary landfill. In the United States the purity of our public water supplies is sacred.

Thursday, March 20, 2014

Fix a Leak Week Once Again

Spring really is just around the corner and so the U.S. Environmental Protection Agency (EPA) has named this week the sixth annual Fix a Leak Week. According to the EPA, one out of every 10 homes has a leak that is wasting almost gallons of water per day that can account for 10,000 gallons of water lost in a home in a year and can account for more than one trillion gallons of water wasted each year across the United States. Reducing wasted water is essential in areas experiencing extended droughts: Texas, California and Nevada and to save money for the rest of us.

Look for dripping faucets, showerheads and fixture connections. Twist and tighten pipe connections, it may be all that is necessary to stop a leak. Though I find that I get mineral build up in my faucets and they need to be disassembled and soaked in hot vinegar and water to dissolve the build up every year or two to prevent drips. Likewise my showerheads need to have the connection between the showerhead and the pipe stem cleaned and tightened regularly. Sometimes fixtures just need to be replaced. When you do, look for WaterSense-labeled models, which are independently certified to use 20% less water and perform as well as standard models.

Check toilets for leaks, the flappers in toilet tanks become worn after several years and leak. Test your toilets by putting a few drops of food coloring in the tank at the back of the toilet and wait 10 minutes before flushing to see if color shows up in the bowl. If there is color, the toilet flapper likely needs to be replaced, which is an easy repair to make. Though it is still a bit early around here you should check your irrigation systems and outdoor spigots too. Though you might want to reconsider your garden and outdoor water use or install rain barrels for watering your garden.

Lawns in general are watered more than other landscaping (though I have never watered mine). The most commonly used varieties of turf grass require more water than many landscape plants, such as ground covers, shrubs, and trees. In addition, homeowners tend to overwater their lawns. As a result, homes with large expanses of lovely green lawns generally use more water (fertilizer and herbicides) than those with a mixture of other plants or the mowed field that surrounds my house.

According to the US Geological Survey total domestic water use in homes totaled 29,400,000,000 gallons per day in 2005, and the “average” US citizen uses 98 gallons a day of water for domestic use, which includes, bathing and bathrooms, laundry, cooking, drinking and outdoor use. Outdoor watering in the drier climates causes domestic per capita water use to be the highest in the driest and hottest climates- the areas of the country facing the biggest water supply challenges Though many water supply companies are facing the reality that the source of their water has limitations and it is expensive to provide and distribute finished drinking water, that realization has not reached most people.


The Earth might seem like it has abundant water, but in fact less than 1 % is fresh water available for human use. The rest is either salt water found in oceans, fresh water frozen in the polar ice caps, or too inaccessible for practical usage. As population grows the demand for freshwater for domestic use and for agriculture to feed us are increasing. However, the supply of water will not increase with demand, the supply of fresh water on earth will always remain constant. And although it's true that the water cycle continuously returns water to Earth, it is not always returned to the same place, or in the same quantity and quality due both to weather and changing climate. While the California and Texas are in an extended and extraordinary drought, I have plenty of water here in Virginia. Though it was not too long ago that well water levels were falling here.

Managing water is a growing concern in the United States. Communities across the country are starting to face that the supply of fresh water is limited and our infrastructure has not been maintained and is failing. Boil water alerts, broken pipes, and supply interruptions are increasing. The United States needs to update its aging water treatment and delivery systems. Many of the states that have projected population growth increases also have higher per capita water use. Strains on water supplies and our aging water treatment systems will result in: Higher water prices to pay for the repair and maintenance of our water infrastructure to ensure continued access to a reliable and safe supply. Higher food costs as farmers’ water allocations are reduced and water costs increase. Increased restrictions on water use to manage shortages. Expensive water treatment projects to transport and store freshwater when local demand overcomes available capacity.

The nation’s capacity for storing surface-water is limited and ground-water is being depleted. At the same time, growing population and regulatory mandates and pressures to keep water in stream flow for fisheries and the environment place new demands on the freshwater supply. We are a nation living on its “credit cards” with our “house” falling apart around us, we just don’t know that we are going broke. The cheapest water is the water not wasted. For those homes on ”City” water and sewer, a quick check of the status of your plumbing fixtures and checking your water usage indicated on your water bill could save thousands of gallons of water a year. Look for changes or increases in water use as well as calculating your absolute use. If your household uses more water than is typical, you might have a hidden leak, or you could be wasteful in your water use. Find out which. Fixing household water leaks can save homeowners about 10% on their water bills.

If like me, you are on well water, you do not have a water bill to track your water use, but you need to be aware of the factors that impact your water supply and regularly practice household water conservation to live within your water resources (it is a budget like any other). Your well is not unlimited and you need to be aware of your water use because wells often have weather and seasonal supply limitations. In addition, the life of a septic system is directly related to the amount of water that flows through your system. Repairing household water leaks could extend the life of your septic system and drainfield. All of us need to become aware of how much water we use and where that water is coming from and eliminate the egregious waste of water leaks.

Monday, March 10, 2014

Groundwater Awareness Week

It’s National Groundwater Awareness Week (March 10-16, 2014). According to George Harlow at the US Geological Survey (USGS) in Richmond, VA about 34% of all drinking water in Virginia is supplied by groundwater and there are 1.7 million Virginians whose drinking water is sourced from groundwater and supplied by their own private wells. Well ownership comes with the responsibility of keeping the water well in good working order and managing your own water supply. Ensuring that your water is safe to drink, of good quality is your responsibility and should be done annually. Managing your water use is an on-going challenge.

The groundwater aquifer you tap for water is not seen so you have to be aware of your water budget and live within it, something that transplants from the suburbs and city are not always aware of. Many who are on public water on the east coast are very accustomed to thinking of water supply as unlimited. Your well is not unlimited and living with a well you need to be aware of your water use and water budget. A diminished water supply can be caused by drop in water level in the well due to drought or over pumping of the aquifer, or the well could be failing (though equipment problems are the most common cause of well failure). Groundwater supply and quality can and do change because groundwater systems are dynamic.

The National Ground Water Association (NGWA) and most health departments recommend that private well owners test their water annually for at a minimum bacteria and nitrate. When you bought your house in all probability you only tested your water for was bacteria, that is not adequate to ensure your water supply is safe. There are many other contaminants that might be of local concern that you could test for and there are common contaminants that can be health hazard or water quality issue; however, not every contaminant needs to be tested for each year. The quality of your water will be determined by the source of the groundwater, the ability of your local geology to protect or impact your aquifer and the absence or presence of a potential local source of contamination. According to the US EPA actual events of groundwater contamination have historically been rare; however, as population density increases and we use more and more chemicals, pesticides and drugs, there are more opportunities to contaminate our groundwater. The most common sources of pollution to groundwater supplies come from two categories; naturally occurring ones and those caused by human activities. Naturally occurring contamination are produced from the underlying soil and rock geology.

Human activities can also contaminate groundwater. Improperly constructed and sealed wells can allow surface contamination to enter the well. Improperly maintained septic systems containing human waste and any chemical you flush down the drain, horses, and backyard poultry can contaminate the groundwater. Leaks from underground storage tanks, excessive use of fertilizers and pesticides, surface disposal of solvents, motor oil, paint, fuel, or nearby landfills or industrial operations can contaminate groundwater. While a confining geological layer can protect groundwater from surface contaminants, there is very limited natural protection in karst terrain and fractured rock systems that are very common in Virginia. So while we have rich supplies of groundwater our aquifers can be very susceptible to contamination.

The Virginia Household Water Quality Program out of Virginia Tech recommends that wells be tested for 14 chemical and bacteriological contaminants: iron, manganese, nitrate, lead, arsenic, fluoride, sulfate, pH, total dissolved solids, hardness, sodium, copper, total coliform bacteria and E. Coli bacteria. The Virginia Cooperative Extension (VCE) Office will be holding a drinking water clinic for well owners on March 31, 2014 in Prince William County and will perform the 14 analysis listed above analysis for just $49. (The water clinics are subsidized by a grant to the Virginia Household Water Quality Program.) That is enough information to address most water problems and ensure that your water is safe for your family to drink. To sign up for the program please call 703-792-7747 or email master_gardener@pwcgov.org.

If your water is supplied by a well, you also need to be aware of the factors that impact your water supply and respond to them, making sure to live within your water budget. There are dry years and wet years and you need to know which you are in. Direct determination of the groundwater level in your well requires a water level meter which can cost hundreds of dollars, but the condition of the aquifer can be obtained from a proxy well. The U.S. Geological Survey, USGS, maintains a group of 20 groundwater monitoring wells in Virginia that measure groundwater conditions daily and can be viewed online. One of the Virginia wells is just up the road from me in the same groundwater basin and is currently measuring at normal groundwater levels. As a matter of fact, all twenty of the Virginia monitoring wells are currently at or above normal groundwater levels, so if you are in Virginia it doesn’t look like there are going to be any problems with water supply this year.
groundwater conditions in Virginia
The water level in a groundwater well usually fluctuates naturally during the year. Groundwater levels tend to be highest in the early spring in response to winter snowmelt and spring rainfall when the groundwater is recharged. Groundwater levels begin to fall in May and typically continue to decline during summer as plants and trees use the available shallow groundwater to grow and streamflow draws water. Natural groundwater levels usually reach their lowest point in late September or October when fall rains begin to recharge the groundwater again. The natural fluctuations of groundwater levels are most pronounced in shallow wells that are most susceptible to drought. However, deeper wells may be impacted by an extended drought and take longer to recover.

In the fractured rock systems of the Piedmont where I live, most wells draw groundwater from vertical fractures in the bedding plane. Fractures can run dry or become clogged with sediment over the years. In unconsolidated sediments of the coastal plain ground water is pulled from the saturated zone. Prince William County is divided between these two areas. To provide a reliable supply of water, a drilled well must intersect bedrock fractures containing ground water and recharge at a rate greater than the typical domestic demand of 5 gallons per minute during periods of water use or have adequate storage within the well itself. In the typical 6 inch diameter well each foot of depth equals about a gallon and a half. So a 200 foot deep well that recharges at 1 gallon a minute could easily serve a family if the water demand were spread out throughout the day.

Failure of the well itself is rarely sudden, but happens especially in drought. A drought caused well failure may be restored when the drought ends. All problems with private wells break down into equipment failure, depletion of the aquifer or other groundwater problems and failing well design and construction. Though not as common as equipment failure, there are times that the problem is the well and the water supply. If the well cannot recharge at the same rate at which water is being pumped out of the well, you will experience intermittent episodes of severe water pressure loss or possibly loss of water entirely. If you have water first thing in the morning and again when you get home from work, but the supply seems to run out especially when doing laundry or taking a shower. Then you may have a groundwater problem or a well problem. Knowing the condition of the local aquifer will allow you to know which.
Thursday, February 27, 2014

Is Manganese in Drinking Water a Neurotoxin?

In the March 3rd 2014 Time Magazine, Alice Park reminds us that low level exposure to many substances can impact development in children. One of the substances cited, almost as a throwaway is manganese in drinking water. Manganese is an essential nutrient involved in the metabolism of amino acids, proteins, and lipids, but in excess can be a potent neurotoxicant as demonstrated in studies of acute exposure. Manganese concentration in drinking water is not regulated in the United States, but the U. S. Environmental Protection Agency (EPA) has a health-based “guideline” of is 300 µg/L maximum level. However, EPA recommends a "secondary maximum contaminant levels" for manganese for aesthetic considerations, such as taste, color and odor of 50 µg/L of manganese in drinking water. The World Health Organization recommends a limit of 400 µg/L of manganese.

There have been very few studies of the possible neurotoxic impacts from chronic low level exposures, the kind of exposure to manganese that would occur from drinking water supplied from groundwater. The largest study (involving 362 children from 251 families) was performed in Canada using communities with a public water supply and private water supplies from groundwater with a natural manganese levels from the bedrock geology and not human activities. The tap water concentration of manganese ranged from 1 to 2,700 µg/L manganese. (MMT the gasoline additive containing manganese has been banned in Canada since 2004, but the highest concentrations of manganese found in that study seem very high. In New England, 45% of wells for public use have manganese concentrations greater than 30 µg/L. According to a 2009 report by the U.S. Geological Survey, about 5% of domestic household wells in the United States have manganese concentrations greater than 300 µg/L.)

The study, “Intellectual Impairment in School-Age Children Exposed to Manganese from Drinking Water,” was published in 2010 in Environmental Health Perspectives, the Canadian journal and is fully cited below examined possible neurotoxic effects from manganese at concentrations they claim are commonly found in North American aquifers. The scientists assessed the relationship between exposure to manganese from drinking water and IQ of school-age children living in communities relying on groundwater. In addition, they examined the relations between manganese concentration in hair follicles and estimated manganese intakes from water consumption and from the food.

Until recently, exposure to manganese from water consumption has been of little concern, because the intake of manganese from ingestion of water is small compared with that from foods, except in the case of infants. In the Canadian study they discovered though manganese consumption from water was very small compared with the amount ingested from foods (by more than two orders of magnitude), yet only consumption from water was significantly associated with manganese concentration in the hair follicles of the children. The mechanism of manganese uptake into hair is not well understood, but it has long been postulated that its affinity for melanin, a protein present in hair, skin, and the central nervous system, could be involved. Though the children had all lived at the same locations for at least 12 months, the duration of that level of exposure is not known.

The scientists found that IQ scores decreased steadily with increasing manganese concentrations in the drinking water. Children in the highest manganese concentration quintile (median, 216 µg/L) scored 6.2 IQ points below those in the lowest quintile (median, 1 µg/L). It is not known whether exposure during a critical developmental period is responsible for their observations. Interestingly enough, manganese concentrations in drinking water were was lower in houses with private wells than houses served from the public well (8 µg/L versus 55 µg/L ). Concentrations of manganese from food and ingestion was estimated.
from Bouchard et al
On March 31, 2014 the Virginia Cooperative Extension (VCE) Office will be holding a drinking water clinic for well owners in Prince William County as part of the Virginia Household Water Quality Program. Samples will be analyzed for: iron, manganese, nitrate, lead, arsenic, fluoride, sulfate, pH, total dissolved solids, hardness, sodium, copper, total coliform bacteria and E. Coli bacteria and costs $49. I have tested my well water consistently and know that my manganese level is 1 µg/L, but I will be testing again to monitor for changes in my water quality.


Maryse F. Bouchard, Sébastien Sauvé, Benoit Barbeau, Melissa Legrand, Marie-Ève Brodeur, Thérèse Bouffard, Elyse Limoges, David C. Bellinger, Donna Mergler. Intellectual Impairment in School-Age Children Exposed to Manganese from Drinking Water. Environmental Health Perspectives, 2010; DOI: 10.1289/ehp.1002321

Thursday, February 13, 2014

In Charleston they Need to Investigate and Remediate

For about a week in the middle of January Charleston (and the surrounding communities) was without drinking water when a leak was discovered in a former fuel storage tank that was being used to store MCHM. By all accounts about 10, 000 gallons (previously estimated at 7,500 gallons) of MCHM was released into the Elk River a mile and a half up river from the water intake for the drinking water supply for Charleston, West Virginia. MCHM is 4-methylcyclohexylmethanol an alcohol with a licorice or mint smell at extremely low concentrations, and though there are limited studies it is believed to have relatively low toxicity. Now a month later, MCHM has been once more detected in the water supply and forced a closing of Charleston schools. The New York Times reports a “Crisis of Confidence,” “emotional public meetings,” and politicians and the U. S Environmental Protection Agency “listening” and “sharing” the public’s concern.

When the MCHM leak was first discovered the West Virginia Department of Environmental Protection, DEP, found a MCHM storage tank with a hole in it sitting within an unlined concrete block containment dike. The DEP inspectors noted a 4 foot wide stream of liquid flowing across the dike and into the ground. So here’s what happened, the MCHM leaked from the tank into an unlined cinderblock containment area and then into the ground through which it began leaching into the Elk River and flowing about a mile down to the Charleston West Virginia water intake for the American Water drinking water treatment plant. MCHM will continue to appear in the drinking water as it continues to leach into the river until the site is remediated.

Governor Earl Ray Tomblin, the state and federal regulators, the water company need to do a little less talking and listening and a little more remediation. This is the drinking water supply for 300,000 people, old, young, healthy, sick, and pregnant- the entire spectrum and the drinking water supply is a potential chronic long term low level exposure to MCHM for years. Ultimately they will end up taking steps to address the public concern, do it now. It is an inelegant solution, but a quick one to remove the tank or tanks and dig up and remove all the contaminated soil to be remediated at a different site away from a drinking water supply. Though in most instances, I would not recommend excavate and haul for a remediation approach because it simply moves a contamination problem, in this instance that is what should be done for the public good, peace of mind of the entire community and safety and security of the water supply. Move all the soil contaminated with a moderately toxic substance away from the drinking water supply. When dealing with a drinking water supply and public concern, a brute force and fast cleanup might be the best answer. Worry about cost and liability later; restore the water supply and the public’s trust in the ability to supply reliable and pure water.

The chemical storage facility is owned by a private company, Freedom Industries, Inc. that primarily appears to distribute chemicals. The site of the leak was once a Pennzoil-Quaker State gasoline and diesel storage terminal that was sold in 2001. These old tanks (reportedly installed around 1938) were apparently put to new use storing chemicals. Though it was common in the past to have fuel storage tanks on rivers, it was not the safest of ideas; however, the fuel arrived by barge. When Pennzoil-Quaker State closed the facility and sold it, the new owners though it was okay to store MCHM in an old 35,000 gallon above ground riveted storage tank that clearly had inadequate secondary containment to prevent a spill into the river. This was all legal, but it should not have been. Chemicals and fuel storage tanks both above and below ground should be permitted for a set number of years that is less than the expected life of the containment system. Instead tanks are allowed to remain in use until they fail. In addition, there are very limited requirements for secondary containment on ASTs and no lifetime limits on equipment age. This metal tank was 75 years old.

We as a nation have lost respect for stewardship and engineering. Politics runs the country and businesses. This is what happens when a nation’s infrastructure is not maintained and it is only going to increase. There are hundreds of examples of mechanical, design and structural failure turning up every day, but only the multi-million dollar problems make the news. The EPA needs to stop focusing all their energies on global issues and refocus their attention on maintaining water quality and availability. As a nation we need to focus on maintaining and improving water, sewage, electricity, roads and essential infrastructure in the United States.

Every four years, America’s civil engineers provide a comprehensive assessment of the nation’s major infrastructure categories in ASCE’s Report Card for America’s. Using a simple A to F school report card format, the Report Card provides a comprehensive assessment of current infrastructure conditions based on: capacity, condition, funding, future need, operation and maintenance, public safety, resilience, and innovation. Our grades average Ds, due to delayed maintenance and underinvestment across most categories. We are a nation of infrastructure deniers.