Showing posts with label electricity. Show all posts

Sunday, May 29, 2022

Drought, Temperatures and Electricity in Summer 2022

The Federal Energy Regulatory Commission, FERC and the North American Energy Reliability Corporation, NERC, have released their annual their summer power reliability assessment. These two reports provide an assessment and evaluation of the electrical power generation and transmission system adequacy to meet projected summer peak demands. The news is not good. 

NERC forecasts that all regions will have sufficient power to meet demand during normal conditions, but all regions may face energy shortfalls (blackouts) during heat waves or low wind conditions. This is especially in the West and upper Midwest where  a nuclear plant was shut down on May 20th without adequately replacing the generation. 

The drought in the west reduces hydroelectric power generation and raises the risk of blackouts there.  The bottom line is the United States can no longer guarantee 24/7 electricity through high demand periods. In addition, the wholesale electric markets expect to see higher prices this summer because of hotter temperatures, slightly increased demand, and higher natural gas prices. This could play out as a failure of policies and planning in the highly regulated electric market.


With different emphasis both reports identify potential reliability issues especially in the western United States. Temperatures have a significant impact on demand for electricity, and higher than average temperatures are expected for the coming summer. The U.S. National Oceanic and Atmospheric Administration (NOAA) forecasts for June 2022 through September 2022 suggest a 50% to 80% likelihood of higher-than-average temperatures.

Drought conditions also create heightened reliability risk for the summer. Drought exists or threatens wide areas of North America especially the west currently in the grips of an unpresented drought. Dry hydrological conditions threaten the availability of hydroelectricity for transfers throughout the Western Interconnection, and will reduce the availability of hydroelectric power in total. Hydroelectric power is the most reliable of the renewable options in the northwest and California plans for the availability to purchase that power when their own generation is inadequate. However, they do not purchase the rights to that power in advance of need.  
Drought Monitor May 24, 2022

Natural gas prices for summer 2022 are expected to rise across the U.S. The futures contract price at the Henry Hub is averaging $7.06 per million British thermal units (MMBtu) for June 2022 through September 2022, up 88% from last summer’s average price of $3.75/MMBtu. Furthermore, demand for natural gas is expected to increase 4.8% over summer 2021 levels to 89.8 billion cubic feet per day due to increases in Industrial, Residential/Commercial, power generation, and net export of natural gas.

This is summer demand when natural gas is not used for heating.


The western U.S. continues to face extreme drought conditions, increasing the likelihood of significant wildfires and reducing the amount of hydropower available. Another risk to the reliability of electrical power is the potential for wildfire. The risk of wildfires may require transmission operators to proactively shut down power in areas of active fires, or during extreme heat and wind conditions to reduce the likelihood of electric equipment sparking fires.

The low reservoir and snowpack levels indicate that the West will see less hydropower as less water is available to move through generators and as reservoir water levels fall below those necessary to operate generation equipment safely. As of May 11, 2022, after below-normal accumulations all winter, late spring storms have brought snowpack levels in the Pacific Northwest above normal, while California’s snowpack level stands at just 22% of normal for this time of year. Everything will have to go right for the electrical grid to function normally all summer. Let's hope.

Sunday, May 22, 2022

Data Centers and Electricity Demand in Virginia

In 2020, electricity sales in Virginia were 115,585 GWh. According to the University of Virginia Energy Transformation Initiative, “Electricity demand in Virginia can be expected to grow fairly rapidly between now and 2035. It will likely continue to grow even more quickly between 2035 and 2050 as the state accelerates its efforts to eliminate carbon emissions from the economy. Most of the shorter-term growth comes from increased sales to data centers in Virginia. In the longer-run, electric vehicles will become an increasingly important contributor to growth in electricity sales.”

Most electricity use sectors in Virginia are not growing, nor is their electric demand. Commercial and industrial demand for electricity in Virginia have both been falling for several years, and the University of Virginia expects this trend to continue for some time. Residential electricity sales are growing very slowly due to slower population growth and improved energy efficiency in homes. The one growing sector of electricity demand in Virginia is data centers, and wow is that growing. Virginia is the data center capital of the nation resulting in electricity use growing faster here than in most other states.

In their forecasts, the University of Virginia’s mid-range estimate for electricity demand to increase 30% (32,800 GWh) by 2035. This forecasted increase does not include any increased electric vehicle sales but rather is entirely due to increased data center power usage. This level of energy demand requires the building of more electrical generation and transmission within the Commonwealth to supply the additional power to data centers. We do not have a spare 30% of the total power demand hanging around. The building of new power generation plants cost more per kilowatt hour than the power produced by the legacy generation we have and will result in our electric bills increasing. Ironically, data centers pay less per kilowatt hour than residential users. 

In Prince William County alone there will be a nine fold increase in data centers when those under development are completed and those proposed are built. Because of data centers in Northern Virginia, growth in electricity demand in Virginia will explode in the short term. Between 2035 and 2050 as the state accelerates its efforts to eliminate carbon emissions from the economy and electrifies the transportation sector demand for electricity will continue to grow. As we electrify everything, and decarbonize the grid, the reliability of the grid comes into question and a larger grid requires more storage to ensure reliability from renewable sources. Data centers require power 24/7 even when the wind does not blow or the sun does not shine. I know from my experience with my solar panels that the production of power varies from month to month and year to year.

Dominion Energy plans to build the 2,640- megawatt Coastal Virginia Offshore Wind (CVOW) commercial project, the largest planned offshore wind farm in the United States. The project will have 176 wind turbines. According to the news release the purchased turbines will be the world’s largest offshore wind turbines in operation — are set to be fully operational in late 2026 and produce up to 14.7 megawatts of power apiece, producing in total up to 2.6 Gigawatts of power.

As reported last week by Sarah Vogelsong in the Virginia Mercury news: “The project is both a key component of Dominion’s plans to decarbonize its fleet by midcentury in line with the Virginia Clean Economy Act and, with an estimated price tag of $9.65 billion, the most expensive endeavor the utility has undertaken to date. If approved by regulators, the average residential customer, defined as someone who uses 1,000 kilowatts of power every month, would see their monthly bill initially rise by $1.45. SCC staff have estimated that figure could rise to $14.21 by the time the project enters operation in2027.”

Though this project was intended as a key component in the plans to decarbonize our grid we can use the costs to look at what data centers cost us. Using the European Union estimates of power production, the Coastal Virginia Offshore Wind project should produce around 5,300 GWh of power a year. It does seem a little low and could be more if the wind blows steady at a usable speed at the coastal Virginia location. If to be conservative  in cost estimates we increase that number to 10,000 GWh of power a year and use the SCC estimate of the monthly increase in electrical bills, then the data centers will cost the average Virginian residential customer an additional $42.63 per month (or $511/ year) on top of the costs we will have to pay to decarbonize our grid under the Virginia Clean Economy Act. The cost of more data centers is beginning to look to high. 

Monday, October 27, 2014

Energy in Virginia

On October 14, 2014 Governor Terry McAuliffe released the 2014 Virginia Energy Plan that contained a snapshot of energy use in Virginia today using data from the Department of Energy’s Energy Information Administration (EIA). I thought I would share some of the highlights so you, too, can see who we are. Even as the energy mix for Virginia changes, it should not be forgotten that Virginia’s Appalachian Plain is coal country. Virginia accounted for 4.5% of U.S. coal production east of the Mississippi River in 2012, and the seaport at Norfolk is America's largest coal export facility that processed and shipped over 38% of U.S. coal exports in 2012. More than half of the energy used in Virginia is imported from outside the Commonwealth. Petroleum for transportation is a big part of that number, but we also import a significant portion of our electricity from out of state.
from EIA

Virginia’s net energy balance is negative, which also is the case for most other states. The big oil producing states and foreign countries provide most of the United Sates with petroleum products for transportation, heating and household use. The Commonwealth imported about 55% of total energy used in 2012, all of the 31.7% of energy used for transportation, in addition to the petroleum products used for heating, but also a significant portion of our electricity which in Virginia is used for lighting, heating, and cooling. Petroleum for all uses represented more than 34% of energy consumed in Virginia last year. Practically all the rest of the energy used, 66% was in the form of electricity from the various sources. The total energy used in Virginia in 2013 came from the following basic energy sources:
  • 34% from petroleum (heating and household use and transportation)
  • 20% from electricity generated outside Virginia
  • 18% from natural gas
  • 13% from nuclear-based electricity generation
  • 9% from coal
  • 6% from hydro, biomass, and other renewable sources 
The average Virginia residential electricity customer uses 14 megawatt hours per year of electricity that costs them an average of $1,584 per year. Virginia households use more electricity than the national average because electricity is used for space heating. Virginians use of electricity is similar to the use in neighboring states where electricity is also the most common heating fuel, according to EIA's Residential Energy Consumption Survey.

Virginia’s retail electric customers are served by three publically traded investor owned utilities (providing 84.1% of electricity used in the state), 13 electric cooperatives (providing 11.5% of electricity) and 16 municipal utilities (providing 4.4% of electricity). Virginia’s utilities own in-state and out-of-state generation facilities, and make contractual purchases of electricity from in-state and out-of-state producers, and spot purchases of electricity from the PJM wholesale market. Virginia’s utilities imported about 37% of the state’s 2012 electricity consumption from generation facilities outside of Virginia.

Electric utilities in Virginia are members of an interstate transmission operator known as PJM which provides independent operation of the wholesale bulk power market for our region. This system increases the reliability of the electric grid at the lowest cost by managing regional supply from lowest cost to highest cost to meet demand. This system has historically put coal powered electrical generation in the “baseload” (lowest cost and most plentiful) category, but that has been changing in response to U.S. Environmental Protection Agency (EPA) regulations targeting coal fired power plants in recent years ( Mercury and Air Toxics Standards, Cross-State Air Pollution Rule, and the Annual Fine Particle Health Standard). In addition, EPA’s recently proposed Clean Power Plan assigns CO2 targets for each state to be phased in between 2020 and 2030. To meet these CO2 limits Virginia will have to further reduce the use of coal generated electricity.

Electricity generated in Virginia in 2013 came from a variety of sources including:
  • 35.7% from nuclear
  • 29.7% from natural gas
  • 28.7% came from coal
  • 4.5% from renewables
  • 1.2% from hydroelectric
  • 0.2 % petroleum entirely imported in Virginia and represents about also is the case for most other states. 
The electricity generated in Virginia represents only about 64% of the electricity used in Virginia. In 2012 Virginia produced 70,739,235 megawatt hours of electricity, but used 109,876,345 megawatts. Nuclear generation provided approximately 40% of the electricity used in Virginia most from our two nuclear power plants the remainder from the PMJ purchases. The available nuclear generated power has not changed in decades, but there are projects that may be completed within the Commonwealth and PMJ in the future.

In 2002, coal provided approximately 52% of the electric power for Virginia but had fallen to 21% in 2013 due to the increasing regulations on coal fired power plants and the extended period of relatively inexpensive natural gas. As the economics and regulatory requirements for coal-fired power have changed, retirements, fuel switches and new natural gas capacity have been announced and are expected to continue under the EPA Clean Power Plan. Total generation in the Commonwealth has shifted from 82% of total megawatt hours produced from coal and nuclear in 2008 to 76% of total megawatt hours produced from natural gas and nuclear in 2012.

The energy generation mix in Virginia continues to change as natural gas becomes more abundant and available, less expensive and prices have enjoyed a period of stable low prices. However, oil and gas prices have historically been very volatile and this is likely to occur again. Saudi Arabia with the financial reserves to withstand a multiyear price war is currently attempting to maintain their world market share of petroleum products against Kurd and ISIS black market sales, Russian and Venezuelan cash flow needs and diminishing world demand as growth in the emerging markets slows even as new techniques increase recoverable gas and oil. Oil and gas prices will fall significantly in the short term even as winter demand is upon us. It will be interesting to see what the composition of the base load will be in the next 15 years, remember before the oil supply crisis in the 1970’s petroleum, not coal made up the lion’s share of our nation’s electricity base load.
in energy equivalent units

Thursday, June 13, 2013

Earth is Projected to Warm 10 degrees Fahrenheit this Century

from IEA presentation
On Monday the International Energy Agency (IEA) released a series of recommendation for measures that might curtail the rapid growth that has occurred in carbon dioxide emission from fuel combustion that has taken place in the past few decades despite treaties, meetings and conferences. Global greenhouse gas emissions are increasing rapidly and, in May 2013, carbon-dioxide (CO2) levels in the atmosphere exceeded 400 parts per million for the first time in several hundred millennia.

The IEA has tracked world energy use since its creation in response to the oil embargo of the 1970’s. Energy use for electricity, industry and transportation accounts for around two-thirds of greenhouse-gas emissions, as more than 80% of global energy is based on fossil fuels.


According to the IEA, policies that are now being pursued by developed nations, are predicted (by the accepted group of climate models) to produce a long-term average temperature increase between 3.6 °C and 5.3 °C (6.5-10 degrees Fahrenheit above pre-industrial conditions), with most of the increase occurring during this century. Unfortunately, until the planet is in severe stress, it is unlikely that a concerted effort by all the nations will even be considered. Until then, the richer nations will dally with reducing their carbon footprint while the emerging nations and China race to build wealth with only limited regard for the environment.

Though mankind has blown through the tipping point in CO2 emissions that was just a decade ago referred to as the point of no return, the IEA is making policy recommendations that might hold the global temperature increase to 2 to 4°C by cutting global CO2 emissions growth so that it does not exceed 38.75 billion metric tonnes from fossil fuels in 2020. The recommendations are:
  • Installing energy efficiency measures in buildings, and requiring increased efficiency in industry and transportation. 
  • Preventing the construction of and limiting use of the least-efficient and dirtiest coal-fired power plants. In addition to increasing the share of power generation from renewable sources (including nuclear) and from natural gas. 
  • Reducing methane released from the processing and distribution of oil and gas by replacing aging infrastructure and improving technology implementation. 
  • Finally phasing-out fossil fuel consumption subsidies to reduce consumption and support efficiency efforts. 

While trying as a first priority to reduce the generation of CO2 from fuel, they are also trying to expand the generation and availability of electricity to poorer nations as another policy program. The IEA and World Bank estimate that there are more than 1.2 billion people who still live without access to electricity and are working to increase electricity availability to the poorest nations on earth which also have the fastest growing populations. This is about 17% of the world’s population living in poverty.

The program to cut world CO2 emissions and the program to expand electricity availability to poorer nations appear to be in conflict, though I suppose that there are policy wonks dreaming that the poorest nations will electrify using only renewable sources of electricity or that the rest of the world will cut their CO2 emissions enough to reduce the overall CO2 trajectory with increasing portions of the earth have available electricity. Without electricity there can be little economic development. Electricity powers critical health equipment to improve the health and survival of the population. Electric lighting supports evening and indoor activities and commerce. Electricity used in classroom to support use of information technology. Electricity powers factories and businesses. Reliable, food, water, sewage and electricity are the necessary infrastructure for an advanced nation.

Thursday, February 14, 2013

2011 U.S. Electrical Power Generation by Fuel


Last week when the Environmental Protection Agency, EPA released the second year of reported greenhouse gas emissions data from large sources they stated in their press release that “Power plants remain the largest stationary source of GHG emissions, with 2,221 million metric tons carbon dioxide equivalent (mmtCO2e), roughly one-third of total U.S. emissions. In 2011 emissions from this source were approximately 4.6 % below 2010 emissions, reflecting an ongoing increase in power generation from natural gas and renewable sources.”

 Many news sources published the press release verbatim. If the increase in renewables was due to the recent surge in construction of wind and solar power generation installations this could be just the beginning in the shrinking of the CO2e footprint of the U.S. electrical grid. A fuel change from coal to natural gas would also significantly reduce the CO2e footprint of electrical power.  I decide to take a hard look at the Electrical Generation Data available from theU.S. Energy Information Administration. The major uses of energy in the United States are heating of residential and commercial buildings (11%), industry (20%), transportation including cars, trucks, trains, planes and ships (27.4%), and electric power generation (40%). Clearly, changes in the makeup of the generating sectors would have a profound effect on the CO2e generation of the nation.
From the U.S. EIA Data

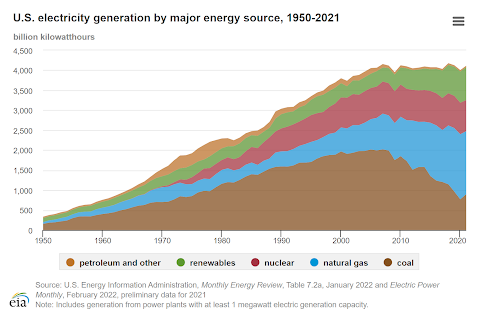
 Overall from 2010 to 2011 electrical power generated in the U.S. fell fractionally less than half a percentage point- 19.40 billion Kilowatt hours to 4,105.7 billion Kilowatt hours of power generated in 2011. Power generated from coal fell 113 billion Kilowatt hours to 1,743.3 billion Kilowatt hours. Power generated from natural gas rose 28.9 billion Kilowatt hours to 1016.6 billion Kilowatt hours. Nuclear power generation fell 16.8 billion Kilowatt hours to 790 billion Kilowatt hours. Hydroelectric power generation rose 64.9 billion Kilowatt hours. Wind generation rose 25 billion Kilowatt hours and solar generation rose 0.6 billion Kilowatt hours.

The big reduction in greenhouse gas emissions appears to be from the overall reduction in fossil fuel based power generation of 93.4 billion Kilowatt hours which also included a reduction in coal generation and an increase in natural gas generation that generates only 56% of the CO2e per Kilowatt hour of power as coal and the significant increase in hydroelectric power. Power generated from renewable sources increased 92.7 billion Kilowatt hours in 2011 over 2010 the largest portion of which is attributed to an increase in hydroelectric power generation.

Since it has been two generations since the U.S. has built large damns, it seems most likely that the increase in hydroelectric generation was due to the heavy rains in that year increasing hydroelectric generation. Unfortunately in the drought year of 2012 the amount of power generated by hydroelectric will fall and fossil fuel generation will have to make up the difference. There has been a permanent  increase in wind power generation capacity as newly built wind farms have been tied into the power grid. This is likely to continue to increase in the short run as long as building the wind farms are subsidized by the government and the expense of connecting the wind generation to the power grid is carried by the rate payers. 

  
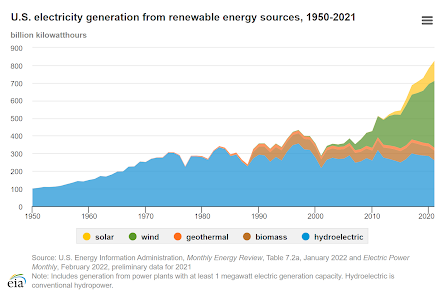
The drop in fossil fuel generation from 2010 to 2011 is almost exactly equal to the increase in renewable power generation- primarily hydroelectric and wind. The U.S. use of electricity is fairly stable at this time. The overall reduction in fossil fuel generation accounts for half the reduction in CO2e the other half of the reduction of CO2e appears to be coming from the migration to natural gas.  A slight reduction in overall generation would account for the difference. While this is exciting news, I was surprised how big hydroelectric generation was overall. Also, we have not built any damns in over two generations so that the hydroelectric capacity is very dependent on how wet a year it is. In the past40 years hydroelectric power generation has fluctuated from a high of around 325-350 billion Kilowatt hours a year during the wet years of the mid 1980’s and 1990’s to the lows of 220-250 billion Kilowatt hours during the early 2000’s. Since, 2012 was a drought year, the CO2e of electrical generation in the U.S. will increase despite the growing importance of wind power generation from 1.34% of power generated in 2008 to 2.92% of power generated in 2011. 
Hydroelectric Generation vs total Electrical Generation 1949-2011