Showing posts with label drought. Show all posts

Wednesday, July 31, 2024

Drought Watch for MCOG and ICPRB


On July 26, 2024, the Drought Coordination Committee of the Metropolitan Council of Governments declared a Drought Watch calling for voluntary water conservation measures by residents of the DC Metropolitan region. This is the second level in COG’s four-stage regional drought response plan. On July 29th the Interstate Commission on the Potomac River Basin (ICPRB) joined in asking residents and businesses to voluntarily reduce their water use due to the area’s dry conditions.

During periods of drought, the ICPRB in the form of the Cooperative Water Supply Operations on the Potomac (CO-OP) helps manage the Washington metropolitan area water supply system by coordinating withdrawals from the Potomac River and off-river reservoirs and recommending releases from reservoirs when forecasted flow in the river is not sufficient to meet expected water demands and the required environmental flow-by of 100 million gallons per day.  The CO-OP begins daily Drought Monitoring when flow at the U.S. Geological Survey (USGS) stream gage at Point of Rocks, Maryland, falls  2,000 cubic feet per second yesterday it was 1720 cubic feet per second. N in fell in the Potomace River basin the day befotr. According to the Middle Atlantic River Forecast Center we may see may see an additional 0.3 inches of rain in the next three days.  

The Wednesday update indicated that:

Fairfax Water Corbalis withdrawal - Potomac: 116 MGD
WSSC Water Potomac withdrawal: 145 MGD
Washington Aqueduct withdrawal - Great Falls: 101 MGD
Washington Aqueduct withdrawal - Little Falls: 49 MGD
Loudoun Water withdrawal: 13 MGD
Loudoun Water Broad Run discharge: 6 MGD
Total Potomac withdrawal: 424 MGD
Total net Potomac withdrawal: 418 MGD

With a little bit of rain in the forecast it is hoped that  conditions will not continue to deteriorate; however if they do, the CO-OP would begin Drought Operations. This occurs when flow in the Potomac River at the at Little Falls dam drops below the total metropolitan area supplier daily Potomac River withdrawals plus the 100 million gallons per day flow-by, or when CO-OP flow forecasts indicate that there is a significant chance that releases from Jennings Randolph and/or Little Seneca reservoirs will be needed within the next ten days.


I believe that with even the limited rain in the forecast we are going to skate through this Drought Warning, too,. Nonetheless, according to the U.S. Drought Monitor, almost 70% of the Potomac River watershed is in either Severe or Extreme drought. Both COG and ICPRB recommend the residents and business reduce water use:

·       Prioritize your outdoor watering. Only water newly planted trees, shrubs, and lawns. A slow drip (versus a heavy pour) will allow the water to reach the root system and not run off the soil.
·       Check faucets and toilets for leaks.
·       Take short showers instead of baths.
·       Run the dishwasher and laundry only when full. Reducing water use will help protect the area’s water supply as well as the aquatic ecosystems of local rivers and streams.

The recommendations are for both public water users and private well owners.

Sunday, July 28, 2024

Climate Change, Mankind and Groundwater

The article below consists of extracts from the USGS, U.S. Forest Service, the National Environmental Health Association YouTube presentation by Dr. Jason R. Barrett, Mr. Joel Pigg, and Dr. Sam Sherchan and the article cited below:

Benz, S.A., Irvine, D.J., Rau, G.C. et al. Global groundwater warming due to climate change. Nat. Geosci. 17, 545–551 (2024). https://doi.org/10.1038/s41561-024-01453-x


Groundwater is ubiquitous and represents the largest distributed store of fresh water on earth playing a central role in sustaining ecosystems and enabling human communities and life. The importance of groundwater for global water and food security will probably increase as the climate warms and as more variability in precipitation (more intense droughts and more intense floods), more variability in soil moisture and surface water increase the need for and value of groundwater.

Over the past 50years, humans have extracted the Earths groundwater at an ever increasing rate, largely to provide food and water for the growing global population and the support the economic development needed for all those people. Extracting groundwater beyond what is replenished will slowly over time use up the aquifer and that is a threat we have been seeing for decades. The Gravity Recovery and Climate Experiment (GRACE) satellites and the associated datasets and hydrological models have focused most of their work on resource quantity and the threat to water supply of over using groundwater beyond its recharge rate.  

Population growth and development has increased the threat to groundwater. This growth has Increased the need for water while reducing the open forested areas and natural grasslands that allow for infiltration of precipitation into the ground.  Reducing the replenishing (recharge) of the aquifer while increasing the demand for water is unsustainable combination as documented by the GRACE data trends. Groundwater is used for water supply and serves to support steam flow between rain storms. As groundwater levels fall, perennial steams that feed the rivers become intermittent and then ephemeral. The groundwater becomes disconnected from the surface water network. Groundwater comes from rainwater and snow melt percolating into the ground. 

The most obvious concern is depletion of groundwater as it becomes an increasingly important water source. As precipitation becomes less reliable due to climate change, surface water bodies can drop too low to provide needed water, causing people to turn to groundwater sources. Over-pumping and depletion of groundwater is already a significant problem in many places across the Eastern Region of the United States. Over-pumping will increase as climate change makes traditional sources of water less reliable, but there are other impacts.

Impervious surfaces prevent groundwater from soaking into the ground. Areas with a large amount of impervious surfaces (such as asphalt, concrete, buildings, etc.) not only are susceptible to flooding but are also susceptible to  higher ambient air temperatures because the man made roads, parking lots, concrete surfaces and buildings absorb and trap heat more heat than natural environments. Impervious surfaces where water runs off into local streams instead of slowly soaking into the ground act as direct routes for rainfall to make its way into streams at higher velocities, but also at poorer quality.

Rain that falls on a parking lot that has been baking in the sun all day during summer gets super heated and then runs off into streams. This heated water can be a shock to the aquatic life in the stream and can harm the water quality of the stream. Along with the heat, runoff from parking lots can contain pollutants, such as leaked motor oil, hydrocarbons from exhaust, leftover fertilizer, and normal trash. 

Temperature of water matters because warmer stream water can affect the aquatic life in the stream. Warm water holds less dissolved oxygen than cool water, and may not contain enough dissolved oxygen for the survival of different species of aquatic life. Some compounds are also more toxic to aquatic life at higher temperatures. Increasing global temperatures caused by a changing climate or the heat island effect of the expansion of the urban built environment are impacting our streams.

While work has accelerated to document the using up of our groundwater resources, there has been little work so far into groundwater quality, including temperature. This is now becoming a more important area of research. Groundwater serves as a cooling system and heat sink for the earth and delivers moderate temperature water to streams. As the impact of mankind and a changing climate increase, groundwater’s ability to cool and feed streams is reduced. Climate change is already having impacts on groundwater resources by changing the location, frequency, and intensity of rain storms. Stormwater flowing directly to streams is warmer. In manmade stormwater ponds evaporation increases contaminant concentration of the water that moves into the water table which is also warmer.  

Other research has shown that this could lead to warmer surface water bodies. Many streams depend on groundwater to maintain their cool to cold-water conditions, which are required by many organisms. The U.S. Geological Survey (USGS) has been measuring how much water is flowing in rivers, determining the water levels of groundwater, and collecting water samples to describe the quality of those waters for over a century. Over this time period, they have taken millions of measurements of , groundwater levels, surface water flow and temperature. 

The research has found that warmer precipitation and recharge will eventually reach streams and rivers as warmer baseflow over the next decades and groundwater levels continue to fall. While a permanent water table decrease of one to three feet may not mean anything for a water supply well, it can have severe consequences for surface water bodies and ecosystems dependent on that shallow water table. In the Potomac Aquifer and the Culpeper Basin the water table has fallen by far more than that.

from EPA 2021


Wednesday, February 7, 2024

Global Groundwater Decline

This article highlights the important work that has been done in this area by Professors Jasecchko and Perrone of U.C, Santa Barabara and has been excerpted from the research of the study cited below. All footnotes for the statement of facts can be found in the original article.

Jasechko, S., Seybold, H., Perrone, D. et al. Rapid groundwater decline and some cases of recovery in aquifers globally. Nature 625, 715–721 (2024). https://doi.org/10.1038/s41586-023-06879-8


In many parts of the world groundwater serves as the primary or a significant source of water for many homes, farms, industries and cities. Unsustainable groundwater use and changes in rainfall can cause groundwater levels to fall, indicating depletion of groundwater resources. Groundwater depletion can threaten ecosystems and economies. Specifically, groundwater depletion can damage infrastructure through land subsidence, impair ecosystems through streamflow depletion, jeopardize agricultural productivity, and compromise water supplies as wells run dry. Groundwater is both used for water supply and serves to support steam flow between rain storms. Groundwater comes from rainwater and snow melt percolating into the ground.

The authors analyzed groundwater-level trends for 170,000 monitoring wells and 1,693 aquifer systems in countries that encompass approximately 75% of global groundwater withdrawals. (Note that our own Virginia aquifer systems were comparatively stable over the time period.)  The authors complemented measurements from monitoring wells with data from the Gravity Recovery and Climate Experiment (GRACE). The GRACE mission consists of twin satellites that precisely measure the distance between them as they orbit the Earth. In this way, the satellites detect small fluctuations in the planet’s gravity, which can at large scales be translated to changes in aquifers.

The authors findings provide the most comprehensive analysis of global groundwater levels to date. The work revealed that groundwater is dropping in 71% of the aquifers. And this depletion is accelerating in many places: the rates of groundwater decline in the 1980s and ’90s has increased since 2000 to the present.  The accelerating declines are occurring in nearly three times as many places as they would expect by chance.

They found that rapid groundwater-level declines (>0.5 meter per year) are widespread in the twenty-first century, especially in dry regions with extensive croplands. Though I should note that irrigation is only necessary to make food for people.  Critically, they found that groundwater-level declines have accelerated over the past four decades in 30% of the world’s regional aquifers. This widespread acceleration in groundwater-level deepening highlights an urgent need for more effective measures to address groundwater depletion.

Their analysis also reveals specific cases in which depletion trends have been reversed following policy changes, managed aquifer recharge and surface-water diversions, demonstrating the potential for depleted aquifer systems to recover if appropriate action is taken. This should serve as a warning that our groundwater resources need to be managed sustainability. The Trends in groundwater levels were found to differ from well to well, and groundwater decline can be found even in regions in which nearby groundwater levels are stable or rising, and vice versa.  This observation highlights the importance of analyzing groundwater-level trends at the scales defined by the boundaries of individual aquifer systems.

The authors also analyzed precipitation variability over the past four decades for almost a third of the aquifers. Within this group they found that 90% of aquifers where declines were accelerating are in places where conditions have gotten drier over the last 40 years. These trends have likely reduced groundwater recharge and increased demand. They state that on the other hand, climate variability can also enable groundwater to rebound where conditions become wetter.

Their work indicates that climatic trends, hydrogeologic conditions, groundwater withdrawal rates, land uses and management approaches have resulted in widespread, rapid and accelerating groundwater-level declines. Nevertheless, the compiled in situ observations also capture numerous cases in which declines in groundwater levels have slowed, stopped or reversed following intervention.   They found that in 265 of the  aquifer systems in the analysis, groundwater-level declines have slowed or reversed, or groundwater levels have risen.

In general, rates of groundwater-level increasing are much slower than rates of groundwater-level decline. Of the aquifer systems with rising twenty-first century groundwater levels, only 6% are rising faster than −0.2 meters per year. By contrast, of the aquifer systems with deepening twenty-first century groundwater levels, 25% are falling faster than 0.2 meters per year. Furthermore, across these aquifer systems, the average rate of twenty-first century deepening exceeds the average rate of shallowing by a factor of four. Thus, rapidly rising groundwater levels are rare, but they demonstrate that aquifer recovery is possible, especially following policy changes, managed aquifer recharge, and inter-basin surface water-transfers. What this study says is we need to actively manage the groundwater (in conjunction with surface water) for a sustainable future. Remember, Of all the water on earth only about  3% is fresh; however, only ½% of the water on earth is available for mankind to use. The rest of the fresh water is locked away in ice, super deep groundwater or polluted beyond redemption.

Wednesday, June 1, 2022

Parts of California are Sinking a Foot a Year

Since the 1920s, excessive pumping of groundwater at thousands of wells in California’s San Joaquin Valley has caused land in sections of the valley to subside, or sink, by almost 30 feet. This subsidence is exacerbated during droughts, when farmers rely heavily on groundwater to sustain one of the most productive agricultural regions in the nation. Once the land subsides it's capacity to hold groundwater cannot be restored.

from Vasco et al

Subsidence induced by groundwater depletion is a grave problem in California’s Tulare Basin, and while certainly not surprise, scientists at NASA have been alarmed by how much faster the areas of the San Joaquin Valley are sinking during this extended drought period. NASA found that sections of the Tulare Basin are sinking at a rate of about a foot a year.

Subsidence can also cause structural damage to the infrastructure we build on top of the earth- like roads, bridges, and pipes.  Often, permanently losing storage space for water as the earth compacts. A group of scientists supported by their various organizations combined the data from two orbiting satellite-based systems to monitor the variations within the Tulare basin at various timescales.

Using the Sentinel-1 Interferometric Synthetic Aperture Radar (InSAR) observations, which provide estimates of the displacements of the Earth’s surface, and terrestrial water storage changes measured from NASA’s Gravity Recovery and Climate Experiment (GRACE) and GRACE Follow-on (FO) missions the scientists were able to model the groundwater changes.

 However,  changes in the gravity field sensed by GRACE and GRACE-FO can be traced to a variety of sources such as ground movement, soil moisture, water table variations, and snow cover. Thus, it was  diffcult, if not impossible, for the scientists to distinguish between water mass changes in the shallow unconfined aquifer and in the underlying confined aquifer using gravitational observations alone.

Corcoran clay separates the shallower unconfined aquifer from the confined aquifer below. Recharge occurs in the unconfined aquifer from snow, runoff, and precipitation. Groundwater storage in both the unconfined and confined aquifers is detected by the GRACE satellites. Compaction, believed to occur predominantly in the confined aquifer, causes the displacement of the Earth’s surface measured by Sentinel-1 Synthetic Aperture Radar (SAR) satellites.

Though much more work needs to be done, results suggest that available Sentinel and GRACE satellite data can indeed monitor hydrological variations over time. With future improvements in observations, and additional satellites planned for 2023, there should be even better monitoring of the changes in the Tulare basin in the future.

Read the article here if you are interested.

Vasco, Donald W., Kim, Kyra H., Farr, Tom G., Reager, J. T., Bekaert, David, Sangha, Simran S., Rutqvist, Jonny Beaudoing, Hiroko K., 2022/03/09: “Using Sentinel-1 and GRACE satellite data to monitor the hydrological variations within the Tulare Basin, California,” Scientific Reports, 3867 vol 12 issue 1.

Sunday, May 29, 2022

Drought, Temperatures and Electricity in Summer 2022

The Federal Energy Regulatory Commission, FERC and the North American Energy Reliability Corporation, NERC, have released their annual their summer power reliability assessment. These two reports provide an assessment and evaluation of the electrical power generation and transmission system adequacy to meet projected summer peak demands. The news is not good. 

NERC forecasts that all regions will have sufficient power to meet demand during normal conditions, but all regions may face energy shortfalls (blackouts) during heat waves or low wind conditions. This is especially in the West and upper Midwest where  a nuclear plant was shut down on May 20th without adequately replacing the generation. 

The drought in the west reduces hydroelectric power generation and raises the risk of blackouts there.  The bottom line is the United States can no longer guarantee 24/7 electricity through high demand periods. In addition, the wholesale electric markets expect to see higher prices this summer because of hotter temperatures, slightly increased demand, and higher natural gas prices. This could play out as a failure of policies and planning in the highly regulated electric market.


With different emphasis both reports identify potential reliability issues especially in the western United States. Temperatures have a significant impact on demand for electricity, and higher than average temperatures are expected for the coming summer. The U.S. National Oceanic and Atmospheric Administration (NOAA) forecasts for June 2022 through September 2022 suggest a 50% to 80% likelihood of higher-than-average temperatures.

Drought conditions also create heightened reliability risk for the summer. Drought exists or threatens wide areas of North America especially the west currently in the grips of an unpresented drought. Dry hydrological conditions threaten the availability of hydroelectricity for transfers throughout the Western Interconnection, and will reduce the availability of hydroelectric power in total. Hydroelectric power is the most reliable of the renewable options in the northwest and California plans for the availability to purchase that power when their own generation is inadequate. However, they do not purchase the rights to that power in advance of need.  
Drought Monitor May 24, 2022

Natural gas prices for summer 2022 are expected to rise across the U.S. The futures contract price at the Henry Hub is averaging $7.06 per million British thermal units (MMBtu) for June 2022 through September 2022, up 88% from last summer’s average price of $3.75/MMBtu. Furthermore, demand for natural gas is expected to increase 4.8% over summer 2021 levels to 89.8 billion cubic feet per day due to increases in Industrial, Residential/Commercial, power generation, and net export of natural gas.

This is summer demand when natural gas is not used for heating.


The western U.S. continues to face extreme drought conditions, increasing the likelihood of significant wildfires and reducing the amount of hydropower available. Another risk to the reliability of electrical power is the potential for wildfire. The risk of wildfires may require transmission operators to proactively shut down power in areas of active fires, or during extreme heat and wind conditions to reduce the likelihood of electric equipment sparking fires.

The low reservoir and snowpack levels indicate that the West will see less hydropower as less water is available to move through generators and as reservoir water levels fall below those necessary to operate generation equipment safely. As of May 11, 2022, after below-normal accumulations all winter, late spring storms have brought snowpack levels in the Pacific Northwest above normal, while California’s snowpack level stands at just 22% of normal for this time of year. Everything will have to go right for the electrical grid to function normally all summer. Let's hope.

Wednesday, May 4, 2022

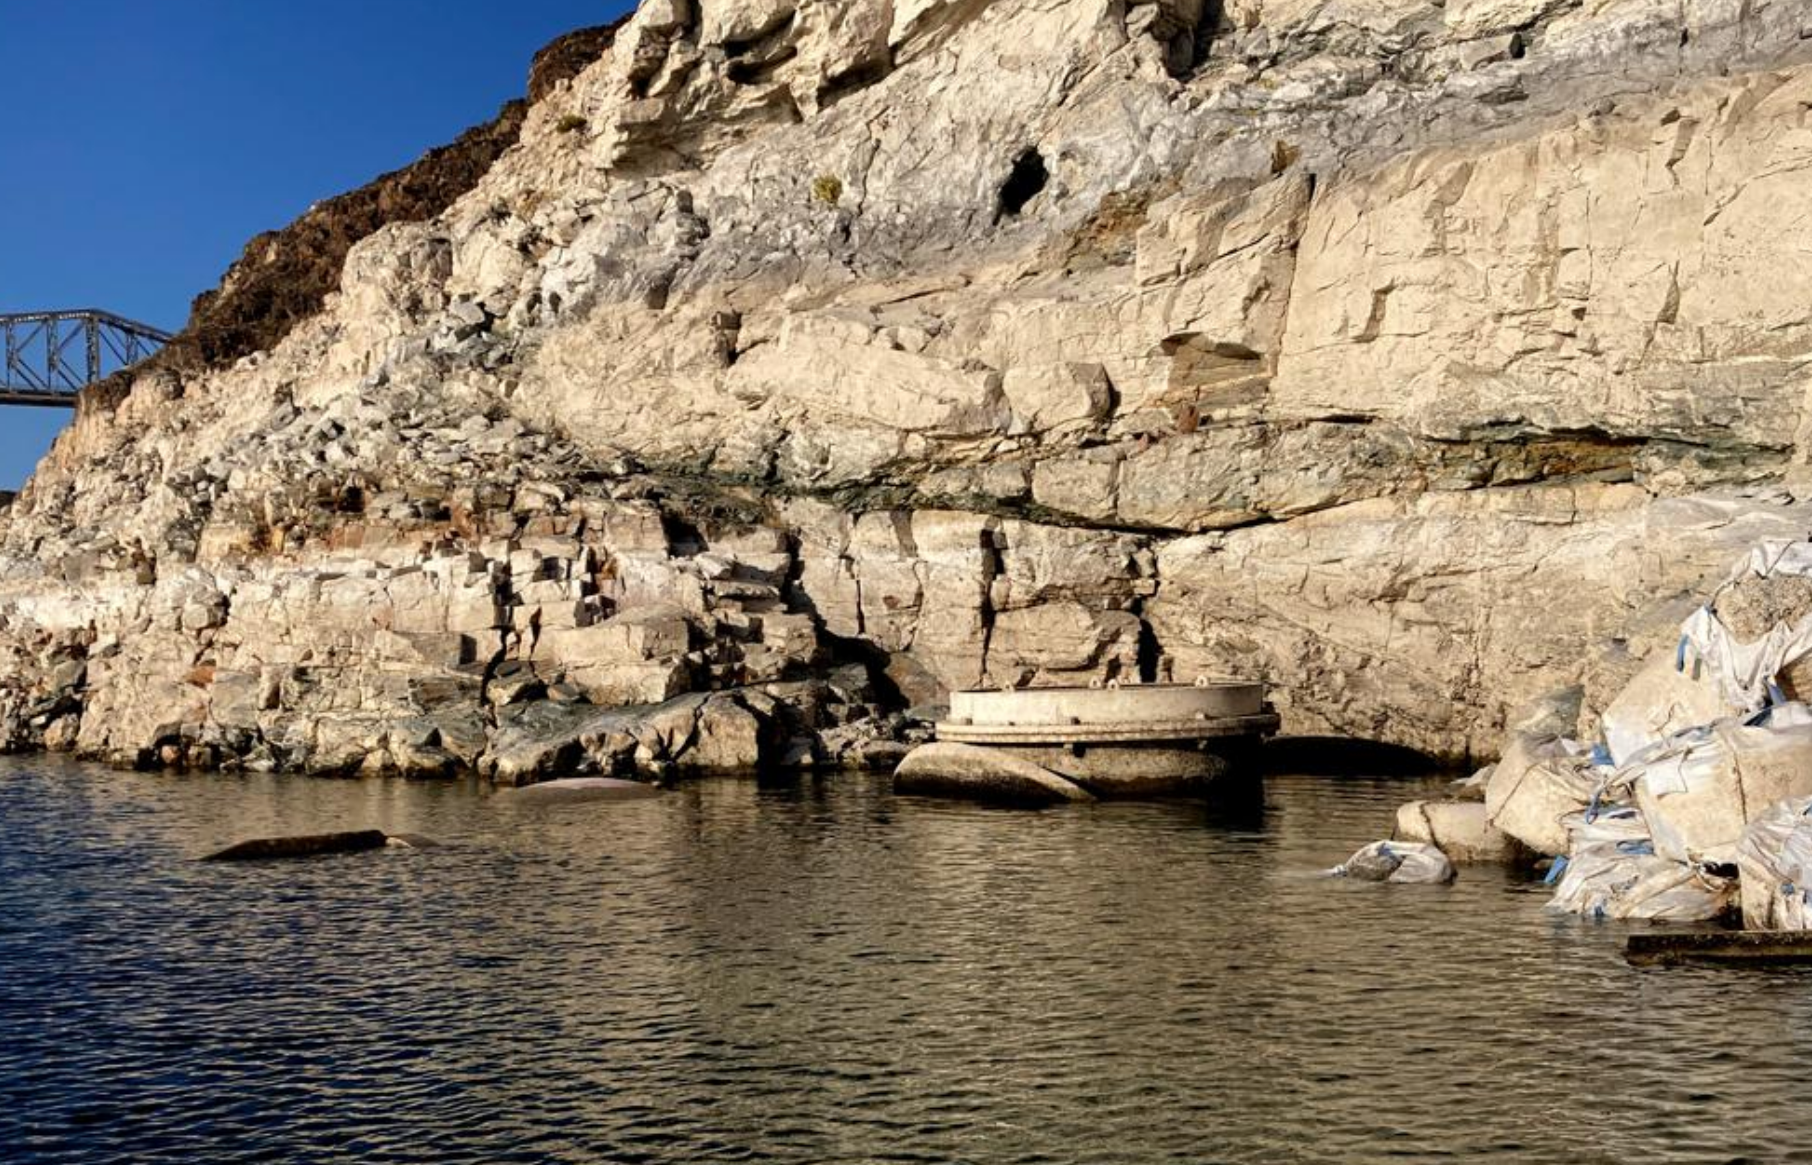
Lake Mead falls below First Water Intake


photo from SNWA 

The Southern Nevada Water Authority announced late last week that after 22 years of drought within the basin, the level of Lake Mead fell below 1,050 feet above sea level. Lake Mead drinking water Intake #1, the topmost pumping station is now above the surface level of the Colorado River reservoir behind Hoover Dam. The intake is the uppermost of three in the lake formed behind the Hoover Dam that provides Las Vegas with 90% of its drinking water supply. 

from Bureau of Reclamation

In their announcement the Southern Nevada Water Authority pointed out that its Low Lake Level Pumping Station #3 installed in anticipation of this happening is operational. Southern Nevada Water Authority constructed the third drinking water intake capable of drawing Colorado River water at lake Mead at elevations below 1,000 feet. Intake #3 ensures Southern Nevada’s access to its primary water supply as lake levels continue to decline due to the drought conditions. The problem is the level of lake Mead keeps falling and despite significant conservation efforts there is no longer enough water to supply the region. There is a time limit on how much longer there will be water.

There has been a drought in the Colorado River Basin for the past 22 years. This combined with higher temperatures has led to what some are calling aridification of the region. Lake Mead has seen more than 130-foot drop in the water level since the turn of the century. The annual flow of the Colorado River is estimated to have fallen about 20% in the 21st Century compared to the 20th Century due to both rising temperatures and drought. The region is in trouble.

from SNWA

The 1922 Colorado River Compact, negotiated by the seven basin states (Colorado, Nevada, Utah, New Mexico, Wyoming, Arizona, California) divided the Colorado River basin into upper and lower portions, allotted the Colorado River’s water on the basis of territory. The allocation of water rights based on territory allowed development to proceed in the lower basin (essentially California) while safeguarding supplies for the upper basin. Then, as now, California's growth and demand for water was viewed with concern by her neighbors.

The problem now is that the allocations promised under the Colorado Compact was based on an expectation that the river's average flow was 16.4 million acre feet per year  and ignored the needs of nature and the tribes. Subsequent studies: however, have concluded that the long-term average water flow of the Colorado is less. In addition, according to the University of Arizona, records going back to paleolithic times (more than 10,000 years ago) indicates periods of mega-droughts in the distant past. 

Now with more than twenty dry years, the reservoirs have dwindled to their lowest levels recorded. Allotted shares of water in the basin exceeds the average long-term (1906 through 2018) historical natural flow of under 16.0 million acre-feet. To date, the imbalance has been managed, and demands largely met by slowly using up the considerable amount of reservoir storage capacity in the Colorado River system-  Lake Powell and Lake Mead that once held approximately 60 million acre-feet (nearly 4 years of average natural flow of the river). It was assumed that drought years would be followed by wet year to refill the reservoirs. That has not happened recently, the last time the reservoirs filled was 1983. The basin is in its 22nd year of drought and the true existential crisis for Las Vegas looms just over the horizon. For without water there is no life.

Monday, August 6, 2018

Climate Change and Cape Town

Cape Town is South Africa’s second largest city. This past spring after three years of persistent drought, the city was almost out of water. The government was forced to limit water use to 50 liters per person per day (that's 13 gallons a day) in hopes of preserving water supply until the rains or be forced to turn off most of its taps to preserve water for hospitals and other essential and urgent needs.

In fear of what the South Africans called "Day Zero” – when the city will no longer have running water, the citizens cut back. The rainy season this winter (recall that Cape Town is in the Southern Hemisphere) started early in their winter and fell at rates closer to the long term average than in the previous three years. The city’s dams are reported to be half full. Cape Town officials hope to relax water restrictions in the next few months. Residents of the Washington DC metropolitan area use about 300 liters of water per day per person- personally it is hard to imagine going months using one sixth of my usual amount of water.

The early winter rains easing the drought have given local officials and politicians the time they need to review the water augmentation schemes launched at the height of the drought crisis to establish the best mix. City of Cape Town Deputy Mayor Ian Neilson said in the South African “News24”: "Now that we have navigated our way through the immediate drought crisis, it is necessary that we review our water supply strategy and augmentation plans to ensure that what was devised in a time of crisis is appropriate for longer-term sustainability and resilience."

According to the city government the water crisis appears to have been caused by a combination of climate change- shifting weather patterns and city mismanagement. Municipal water comes primarily from surface reservoirs that rely entirely on rainwater, and were designed to withstand up to three years of lower-than-average rainfall. But with the growing population and a reported increased likelihood of drought, the city needs to have major backup or augmentation resources.

World Weather Attribution (WWA) says that their computer model using proxy data found that changing climate has made the recent drought three times more likely than in the past. WWA is a four year old international effort designed to sharpen and accelerate the scientific community’s ability to analyze and communicate the possible influence of climate change on extreme-weather events such as storms, floods, heat waves and droughts. WWA seeks to identify the human fingerprint on individual extreme-weather events. This has been the goal of the scientific community for more than a decade. Right now, studies of the attribution of extreme events such as those in the Bulletin of the American Meteorological Society (BAMS) take months to complete and are published long after the event.

A team brought together by WWA used the available southern Africa rainfall records to run several climate models. Rainfall records from Cape Town do not go back very far. The oldest rainfall records in the western cape region of Africa go back to 1930, but most are not that old. The WWA team used the data they had to run their climate models without the 1 degree C increase in temperature the earth has experienced since 1900 and then with the 1 degree C increase. The team concluded that changing climate tripled the risk of such a severe drought and if the planet warms a further degree it will triple again.

Cape Town needs to make its water supply sustainable and resilient to survive more frequent and longer droughts. With the increased demand from a growing population and economy, and with climate change models predicting a drier Cape Town, the City has realized that it cannot rely only on rainfall for future water supply.

Thursday, June 14, 2018

A Wet Year

The Washington Post recently reported that due the very rainy few weeks we just had, the Potomac river hit its highest levels since March 2010 in areas all over the Washington, D.C. area. The Interstate Commission on the Potomac River Basin (ICPRB) reports that we have water and that there is a below normal probability of needing water from the Washington metropolitan area’s back-up water supply reservoirs for the 2018 summer and fall seasons.

Our backup water supply is held in the Jennings Randolph and Little Seneca reservoirs. The need to release water from the reservoirs is triggered by low river flows brought about by a combination of low summer precipitation and low groundwater levels.

This year the average precipitation in the Potomac basin has been significantly above normal for the month of May. Recent rainfall has caused flooding in many areas of the basin. Streamflow data from the U.S. Geological Survey shows that flows are above or much above normal. Their gauges reported that the flow rate of the Potomac at Goose Creek was over 4 times the long term median, and at Point of Rocks the flow of the Potomac River was over 3 times the long term median.

Groundwater levels are near normal. According to the Middle Atlantic River Forecast Center, the outlook for water resources and water supplies is good in the Potomac Basin. At present, there is sufficient flow in the Potomac River to meet the Washington metropolitan area’s water demands without augmentation from upstream reservoirs. The latest U.S. Drought Monitor did not report any areas of Virginia in drought or even dry.

Data from the National Weather Service’s Middle Atlantic River Forecast Center (MARFC) shows that the Potomac basin upstream of Washington, D.C. has received a precipitation total above normal for April, and that precipitation was abundant for the month of May. In the past week alone, heavy rain (generally 2-6 inches over the region, and locally much greater) fell across much of Virginia, Although southern Virginia did not receive the very heavy rainfall that was reported just to its north, it still received enough to eliminate any residual dryness. Finally, it looks like we’ve got your wet year to recharge the basin. 

The ICPRB, through its Section for Cooperative Water Supply Operations on the Potomac, coordinates water supply operations for the regional water utilities during times of drought and recommends releases of stored water. These operations ensure adequate water supplies for Washington metropolitan area water users and for environmental flow levels. The water supply outlooks are published on a monthly basis between April and October.

Monday, February 23, 2015

NASA Probe to Improve Climate and Weather Forecasting

from NASA
On January 31, 2015 NASA successfully launched the SMAP (Soil Moisture Active Passive) mission satellite.  The SMAP mission will provide global measurements of soil moisture and its freeze/thaw cycle from a near-polar sun-synchronous orbit. The plan is for SMAP to measure soil moisture every 2-3 days over at least a three year mission.

The SMAP mission will provide global mapping and monitoring of landscape freeze/thaw cycle and surface soil moisture content. The data will be used to model and estimate the earth carbon/ carbon dioxide fluxes and underlying environmental controls. Scientists hope that these observations will allow them to link together the terrestrial water, energy and carbon cycle processes and identify why the climate models have failed to predict the last 15 years of near stable global temperatures. Scientists hope to use this and other global data to identify the functioning of the “missing carbon sink” that has slowed the predicted rise in global temperatures. NASA hopes that SMAP will bring us some of the data we need to better understand our planet and predict its future. Though, the most immediate benefit will be drought prediction.

SMAP will accomplish its mission by measuring how much water is contained in the top layer of soil and identifying when the ground is frozen. This is accomplished using an instrument that combines an L-band radar and an L-band radiometer that both share a 6 meter in diameter aperture reflector. The reflector will rotate to scan a 621 mile wide swath of earth on each orbital pass of the observatory. The radiometer provides “passive” measurements of the microwave emissions of the upper soil. The radar makes the “active” back scatter measurements of the surface. Thus, the name of the mission- Soil Moisture Active Passive.

The ground processing systems run by the NASA Jet Propulsion Laboratory and the Goddard Space Flight Center will combine the data sets. Combining the active and passive datasets increases the resolution and accuracy of the data. Together the instruments will be able to measure the moisture in the top two inches of soil to a spacial resolution of under two miles.

The SMAP mission will also collect data on the frozen/thawed state of the soil. This information is important to understand the length of the plant growing season and will increase our understanding the contribution of the boreal forest to the global carbon balance and contribute to a better understanding of droughts and climate.

A high-resolution, space-based measurement of soil moisture is a new capability. Scientists will be able to better predict natural hazards of extreme weather, climate change, floods and droughts, and help reduce uncertainties and unknowns that now exist in our understanding of Earth's water, energy and carbon cycles. Several of the data gathering techniques grew out of previous NASA missions of this century including the Aquarius project and the cancelled Hydros project.

The microwave portion of the electromagnetic spectrum (wavelengths from a few centimeters to a meter) is used to estimate the surface soil moisture. Passive microwave sensors measure the natural thermal emission emanating from the soil surface. The intensity of this radiation depends on the dielectric properties and temperature of the target medium, which for the SMAP mission is the surface soil layer and is a function of the amount of moisture present. The low microwave frequencies used offer additional advantages; the atmosphere is almost transparent in that wavelength so weather does not impact the sensing, transmission of the data from the soil is also possible through sparse to moderate vegetation water content, and the microwaves measurements are not impacted by daylight to allow for 24 hour observations.


The SMAP mission will map the entire globe every two to three days for at least three years and provide the most accurate and highest-resolution maps of soil moisture ever obtained. The spacecraft's final circular polar orbit will be 426 miles (685 kilometers), at an inclination of 98.1 degrees. The spacecraft will orbit Earth once every 98.5 minutes and repeat the same ground track every eight days.

Weather forecasting, accurate modeling and forecast of climate variability and change, planning and predicting agricultural productivity, effective water resources management, drought prediction, flood area mapping, and ecosystem health monitoring all require information on the status of soil moisture. Soil moisture affects plant growth and agricultural productivity, especially during times of drought or water shortages. This can improve our ability to monitor and forecast agricultural productivity and allow for a famine early warning in the most food insecure regions of the earth.

Monday, October 13, 2014

Chesapeake Bay Watershed has Plenty of Water this Year

The lead editorial in Science magazine last month began “The Western Hemisphere is experiencing a drought of crisis proportions. In Central America crops are failing, millions are in danger of starvation...” Editor Marcia McNutt goes on to illustrate the extent and severity of the drought and then to talk about the advances being made in measuring water availability using the Gravity Recovery And Climate Experiment (GRACE) satellites to measure large scale changes in groundwater and moisture from space and a new method for measuring groundwater extraction by measuring regional land uplift (Borsa et al., Ongoing drought-induced uplift in the western United States, Science vol. 345 issue 6204 page 1587). These new methods are allowing scientists to begin to measure the amount of groundwater extracted from an aquifer and the remaining water. This is a first step in managing surface and groundwater together. Both surface and groundwater are part of one connected system responding on different timescales to precipitation based on specific geology. The availability of water resources are not constant and certainly not unlimited.

We chose to live in this little corner of Virginia for the water (on my part) and proximity to my husband’s home or origin. While several counties of Virginia were abnormally dry this past September (according to the Drought Monitor), the dry area was south of us. Groundwater levels in the monitoring well down the road have been normal for most of the year. We seem to be doing just fine this year sitting as we do between the Potomac River and Bull Run and have plenty of water. The National Weather Service’s Middle Atlantic River Forecast Center (MARFC) reports a Potomac basin total precipitation of 28.3 inches of precipitation so far this year thought that is 2.3 inches below normal- 2.2 inches of that shortfall, was in September. Both MARFC and the NOAA are prediction a wet fall along the Potomac watershed and the south in general. Texas is finally seeing relief and recovery from their drought. The drought is California is expected to continue north of the Colorado River. 
from the climate prediction center


The Potomac River is the fourth largest river along the Atlantic seaboard and the lifeblood of our region. The Potomac River starts life as a spring at the Fairfax Stone in West Virginia. The river flows approximately 385 miles to the Chesapeake Bay increasing in size and flow from its tributary streams and rivers in West Virginia, Maryland, Pennsylvania, Virginia, and the District of Columbia growing to become the Bay's second largest Tributary. The River provides more than 500 million gallons of freshwater daily to those living in its watershed, in addition to irrigation water, and the more than 2 billion gallons of water a day for power plants.

The Potomac River is one of the least dammed large river systems in the Eastern United States. The combined storage capacity of all major reservoirs upstream of Washington, DC makes up less than 7% of median flow. Nonetheless, the Potomac River’s flow needs to be managed to assure the 500 million gallons per day the river supplies for drinking water to the region and the approximately 100 million gallons necessary for essential environmental services. The Interstate Commission on the Potomac River Basin (ICPRB) was created to manage and allocate the flow of the Potomac River. They reported last week, that despite a dry September recent rains have ensured that there is sufficient flow in the Potomac River to meet the Washington metropolitan area’s water supply demand without the need for water releases from the upstream reservoirs- Little Seneca and Jennings Randolph to keep the river at adequate flow.

The ICPRB manages the water withdrawals from the Potomac River by having Fairfax Water utilize their Occoquan Reservoir water treatment plant to maintain adequate flow to the Chesapeake Bay and having the other water utilities utilize their storage. The ICPRB reports it’s very unlikely (1-3% likelihood) that river flow will have to be augmented with water released from either the Little Seneca or Jennings Randolph reservoirs this year. Our region is well‐protected from a water supply shortage because of carefully designed drought‐contingency plans and continued strong precipitation. In addition to help maintain a consistent water supply, WSSC (the Maryland water utility) has their Patuxent reservoirs with a capacity of more than 10 billion gallons that is currently over 80% full and more reservoirs are planned for the entire system to ensure the water supply for the region can endure a prolonged drought. Back in the 1960’s during a severe and extended drought, when the population was only a fraction of what it is now, water withdrawals to supply drinking water to the three water utilities in the region from only the Potomac River reduced flows in the Potomac to such an extent that the River practically ran dry, leaving only mud between Great Falls and the tidal river.
Each fall when the Potomac is at its lowest flow the ICPRB maintains daily monitoring of the flow at Point of Rocks and Little Falls to always be prepared for the possibility that more serious drought conditions may develop in the upcoming weeks. At present, there is sufficient flow in the Potomac River to meet the Washington metropolitan area’s water demands, but the ICPRB remains diligent and watchful because weather as we know is changeable. 

from ICPRB
The U.S. Geological Survey (USGS) reports that groundwater levels are generally near normal for the region with both above and below normal levels scattered throughout the area. If your water is supplied by a well, you need to be aware of the factors that impact your water supply and regularly practice household water conservation to live within your water resources when necessary. Unfortunately, we do not have the ICPRB to help us manage our water resources and use. There are dry years and wet years and water will vary, though it is not always obvious. The groundwater aquifer you tap for water is not seen so you have to be aware of your water budget and live within it, something that transplants from the suburbs and city are not always aware of. 


My groundwater is very young, basically the groundwater levels in my well and the nearby USGS monitoring wells respond within a day to a rain storm despite being more than 100 feet deep. In many groundwater systems are not as directly tied to precipitation and so that is not true. Many well owners think of their water supply as unlimited until the well fails. Your well is not unlimited and you need to be aware of your water use. You need to be aware of the relationship between groundwater and surface water and how your well responds to drought and rainfall. During dry periods when my garden is in most need, my well is most vulnerable. I will only water my herbs and new plantings. Everything else in my garden has got to make it on what our climate provides (though I would probably try to save the cherry and plum trees in a drought- but not at the risk of my water supply).

USGS monitoring well 49V 1 shows a response to rainfall

Monday, September 8, 2014

Protect Our Groundwater

Tomorrow, September 9, 2014, is national Protect Your Groundwater Day. This annual event is sponsored by the National Groundwater Association to raise awareness of what you can do to prevent groundwater contamination. However, groundwater is also in danger from unsustainable use during droughts, changing rain and snowfall patterns or from overuse.

The L. A. Times recently reported that hundreds of private drinking water wells in California have run dry. Tulare County is delivering water to hundreds of residents because their wells are dry and they are without water. The water level in the Central Valley has fallen and wells have gone dry from a combination of extended drought and unsustainable use of the groundwater. There is no easy or cheap solution to a dry well and groundwater in California is a limited resource. Though surface water is allocated in California based on a series of rights, there is no management of groundwater in California or much of the country. Protecting groundwater resources includes ensuring we use the resource sustainability.

If your water is supplied by a well, you also need to be aware of the factors that impact your water supply and respond to them, making sure to live within your water budget. There are dry years and wet years and you need to know which you are in. Direct determination of the groundwater level in your well requires a water level meter which can cost hundreds of dollars, but the condition of the aquifer can be obtained from a proxy well. The U.S. Geological Survey maintains monitoring wells throughout the nation and you can often gain important information from these wells. However, there is little you can do to prevent neighbors from using the groundwater for irrigation or even to encourage reducing water use during a drought. During drought groundwater use increases. As a nation we use over 75 billion gallons of groundwater each day. Irrigation is typically the largest user of this water. Techniques and frameworks for managing groundwater resources are still evolving.
from USGS
I am one of the 13.2 million U.S. households whose water is supplied by a private well. In addition, there are 107,848 community supply groundwater wells that supply water to 40,301 community public water systems. The National Ground Water Association reports that 44 % of the U.S. population depends on groundwater for its drinking water supply from either a public source or private well. Since many public water system draw all or part of their supply from groundwater, protecting groundwater from contamination protects the water supply and impacts the costs for water purification and treatment. There was a time when groundwater was considered to be free from contamination, but that is no longer true. As population density increases and we use more and more chemicals, pesticides and drugs, there are more opportunities to contaminate our groundwater.

While community wells are required to test their water under the Safe Drinking Water Act, if you have your own well, then the responsibility for ensuring that your family and friends are drinking safe water rests with you. Just because your water appears clear doesn’t necessarily mean it is safe to drink. You cannot taste bacterial contamination from human and animal waste, nor nitrate/ nitrite contamination. Many chemical contaminants cannot be tasted or smelled at levels that can impact your health. The National Groundwater Association recommends that all drinking water wells should be tested for Coliform bacteria and E Coli annually. Testing is the only way to detect contamination in your water. Testing is not mandatory, but should be done to ensure your family’s safety.

Groundwater comes from rain water and snow melt percolating into the ground. Typically, the deeper the well the further away is the water origination and the older the water. The groundwater age is a function of local geology, the amount of precipitation and the rate that water is pumped out of the aquifer. Geology also determines the ease with which water and contaminants can travel through an aquifer; microorganisms in the soil and from wildlife and spilled chemicals or contaminated runoff can travel into groundwater supplies through cracks, fissures, and other pathways of opportunity like fractured rock systems. The land surface through which groundwater is recharged must remain open and uncontaminated to maintain the quality and quantity of groundwater.

Nitrate concentrations are often elevated in shallow groundwater because of agricultural and suburban development. Bacteria and nitrate contamination to groundwater can be caused by human and animal waste. Poorly managed septic systems, horses, backyard poultry can cause contaminate groundwater by overwhelming the ability of the soil to filer these contaminants or finding an opportunistic pathway through a fissure or other geological entry. An emerging concern in recent years has been the occurrence of pharmaceuticals and personal care products in septic waste water. Nitrate contamination can serve as a proxy for other trace contaminants in septic systems. Heavy local use of pesticides for ornamental gardens or farms, buried waste, and leaks from underground fuel tanks can be sources of contamination.

Households can introduce solvents, motor oil, and paint; paint thinner, water treatment chemicals and others substances by spilling them, or pouring chemicals into the ground or down the drain into a septic system. Groundwater protection depends on the entire community. The National Groundwater Association recommends: That everyone store hazardous household substances safely in a sealed container in a secure place and use hazardous substances only according to the manufacturer’s recommendations. Hazardous substances should be disposed of safely and properly. Be mindful of your water use, install WaterSense fixtures and limit exterior water use. If you own water well, make sure that all possible contamination sources are a safe distance from the wellhead (50-100 feet), make sure your septic system is operating and maintained properly and is regularly inspected and the tank is regularly pumped. Also, test your water annually.

Thursday, September 4, 2014

California Water Use

from the CA Department of Water

Every five years the U.S. Geological Survey (USGS) compiles and publishes national water-use estimates for each state and the United States as a whole. Over time these snapshots of water use can identify trends within the states. In response to the severe drought in California, the worst in modern records, the USGS has released the 2010 water-use estimates for California early- ahead of the other states. These water-use estimates are important to state regulators and water managers who use the data as inputs to their hydrologic models that they use for water resource planning and management. The water use estimates combined with the hydrologic models can help water managers, regulators and elected officials assess the changing demographics, land use, irrigation practices, climate, and water availability impact water use and the economy of the state. So, hot off the presses here is what the 2010 data shows.

Total waster use in California fell from 2005 to 2010. According to the USGS, 38 billion gallons per day (42,000,000 acre-feet per year) of water were withdrawn from groundwater and surface-water sources in 2010 while 46 billion gallons per day (52,000,000 acre-feet per year) in 2005. Overall, water use in California decreased by 17%. In 2010, Californians withdrew an estimated total of 38 billion gallons per day (42,000,000 acre-feet per year), 25 billion gallons per day (28,000,000 acre-feet per year or 67%) were supplied by surface water and 13 billion gallons per day (15,000,000 acre-feet per year or 33%) was supplied by groundwater. In 2005 35 billion gallons per day (39,000,000 acre-feet per year or 76%) was supplied by surface water and 11 billion gallons (12,000,000 acre-feet per year or 24%) was supplied by groundwater. California has increased their dependence on groundwater between the two dates, but that could have been caused by the lingering effects of the 2007-2009 drought. In California 2005 was in the middle of the last wet period.
from USGS


The California drought of 2007-2009 was ending in 2010, however while most farmers in the Central Valley got their full federal water allotment that year, the west side of the San Joaquin Valley did not receive full water allocations. The state water project allocation remained well below normal that year. At the time the state officials attributed the reduction in a wet year to strict pumping curbs in the Sacramento-San Joaquin Delta, to protect salmon and smelt populations, and because Oroville has been slower to refill than some other reservoirs. The increased use of groundwater between 2005 and 2010 could be a trend or it could simply be that groundwater was used to make up the shortfall by the farmers in the west side of the San Joaquin Valley. The variations in rainfall that California experiences allow the state to struggle from wet period to wet period without planning for the future.
from USGS


A significant portion of the 17% reduction in daily water use between 2005 and 2010 was from a reduction in thermoelectric water use. Only about 82% of water withdrawals, or 31 billion gallons a day in 2010 were fresh water, the rest was saline water. In California 95% of saline water withdrawals are used for thermoelectric generation (most of the rest for aquaculture). In 2005 72% of water withdrawals or 33 billion gallons a day were freshwater. Thus, from 2005 to 2010 freshwater use fell 6% in California. In both 2005 and 2010, about 74% of all fresh water withdrawals were for irrigation so most of the reduction in freshwater withdrawals was in irrigation allocations and probably an increase in water reuse in urban centers.

The 38 billion gallons per day (42,000,000 acre-feet per year) of withdrawals in 2010 were distributed among eight categories:
  • Irrigation: 61% (23,000 million gallons per day, or 26,000,000 acre-feet per year).
  • Thermoelectric power generation: 17% (6,600 million gallons per day, or 7,400,000 acre-feet per year). This water is saline and not usable for irrigation or consumption.
  • Public supply: 17% (6,300 million gallons per day, or 7,100,000 acre-feet per year). Average daily gross per capita use was 181 gallons, this is very high individual use probably attributed to outdoor use- watering all those suburban lawns.
  • Aquaculture: 3% (970 million gallons per day, or 1,100,000 acre-feet per year).
  • Industrial:  1% (400 million gallons per day, or 450,000 acre-feet per year).
  • Mining: 0.5% (270 million gallons per day, or 300,000 acre-feet per year).
  • Livestock: 0.5% (190 million gallons per day, or 210,000 acre-feet per year).
  • Self-supplied domestic use: < 0.5% (170 million gallons per day, or 190,000 acre-feet per year). Average daily per capita use was 69 gallons. This number is in line with per capita use in Virginia in 2005 and may only reflect that you do not water your lawn off your well. 
In California an arid state, average daily use of water by individuals on public supply is 181 gallons a day. This is more than two and a half times the per capita use for those on private wells and in places like Virginia. This use has to be for exterior water use, watering gardens and lawns. The watering restrictions in place for the current drought are attempting to address this area. However, in California 74% of fresh water is used for agricultural irrigation. Without irrigation, crops could never be grown in the arid and semi-arid lands of California where agriculture is a $45 billion dollar industry, subsidized by cheap water. Let’s hope that the USGS data can help California manage their water into the future.

Monday, September 1, 2014

Whose Water ?

On Saturday, the U.S. Bureau of Reclamation began releasing 25,000 acre feet of water from Trinity Lake in Northern California part of the federally-owned Central Valley Project (CVP). The water will be released for two weeks from August 30th until September 14th. The water is being released to protect the Chinook salmon in the Klamath River from an anticipated fish kill like the one experienced in 2002, another severe drought year. The Central Valley farmers have had their water allocation cut to zero this year because of the drought. The Westlands Water District, the largest supplier of irrigation water in the U.S., and its water supply company, the San Luis & Delta-Mendota Water Authority filed a petition to have the U.S. District Judge in Fresno, CA, Lawrence J. O’Neill halt the release to preserve the water.

Last Wednesday Judge O’Neill denied their request to stop the water releases ordered by the U.S. Bureau of Reclamation. In his decision the Judge noted that the potential harm to the water district and water authority from the potential loss of 25,000 acre feet of Flow Augmentation Releases (FAR) water from the potential water supply for 2015 did not outweigh the potentially catastrophic damage that seemed certain to occur to this year's salmon runs in the absence of the 2014 FAR. In his decision, Judge O'Neill cited a report from the tribal fisheries consultant that the extra water was needed to prevent an outbreak of disease from a parasite known as ICH, short for Ichthyophthirius multifiliis that attacks fish crowded together in drought conditions. The parasite was the prime killer of salmon in the 2002 drought.

The Bureau of Reclamation ordered the emergency releases after native Tribes that depend on the salmon for subsistence, ceremonial and commercial fisheries pressed the bureau to reverse an earlier decision to only release more water after a significant numbers of fish began to die. The Bureau of Reclamation has not been consistent with their standards for environmental Flow Augmentation Releases and has yet to develop a clear standard. There is the impression that the Bureau of Reclamation has not been consistent or entirely fair in their determinations. The FAR would likely mean less water stored for next year if the drought continues. The Hoopa Valley Tribe has for decades led the fight for ecologically-sufficient water releases from Central Valley Project (CVP) dams located on the Trinity River. Farmers are enraged by the release when their pleas for more water have gone unheeded. This is just the latest chapter in California’s long history of battles (often carried out in court and back rooms) over water.

Today the California Department of Water Resources (DWR) “owns” for the California state-owned State Water Project (SWP) just as the U.S. Bureau of Reclamation “owns” the federally-owned Central Valley Project (CVP) water. Together they form the largest water storage and transportation system in the world with 1,200 miles of canals and nearly 50 reservoirs. About 15 years ago the California Public Utilities Commission described the scope of the size of the system as capturing enough water to irrigate about four million acres and provide water to 23 million people. However, since then the population has grown and agriculture has expanded. Today there are reported to be more reported to be 9 million acres of prime irrigated land (though irrigating efficiency has improved greatly) and there are 38 million people and therein lies the problem.

The amount of precipitation that falls on California has not changed significantly over the last two hundred or so years. The average annual rain and snow fall produces approximately 200 million acre –feet of water (326,000 gallons per acre foot). In addition, the approximately 450 groundwater aquifers are thought to store about 800 million acre feet of water only a fraction of which is readily usable as a water supply. However, it is a mistake to think of California in terms of averages and regular cycles of precipitation. Since 1960 almost 40% of years have been drought years. The evidence from modern records and tree rings indicate alternating cycles of severe drought and heavy precipitation. The tree-ring studies indicate one 61 year drought from 1760-1820. Right now California is experiencing the most severe drought in the past century. This may be the result of a changing climate, the beginning of a long period of drought or just extreme weather. No one really knows, but the presiding belief is that California is facing a dryer future.

There has never been enough rain in California for there to be agriculture without irrigation. Even the native Californian Indian populations in the Owens Valley and the lower Colorado River used dams and earthen canals to divert water to irrigate fields, though in the Colorado River basin they relied on periodic floods rather than canals. Irrigated agriculture is believed to have evolved in California about a thousand years ago when the climate became drier. In the time of the native Californians the king salmon once could be found in abundance in the 650 miles of uninterrupted California waterways. In the age before massive dams and aqueducts, California’s rivers flowed uninterrupted into valleys, marshes, bays and the ocean. Two hundred years ago the central valley had year round streams, lakes and marshlands that expanded and contracted with the season and drought cycle.

Today, between the State Water Project and the Central Valley Project almost 80% of California’s developed water supply is used for agriculture. Of the total water supply, agriculture uses more than 52% of the total water supply in the state in a dry year, but 29 %: of the total water supply in a wet year. Agriculture cannot compete economically with the urban/industrial sector for water. Agriculture uses a large amount of water per unit of production (grapes, almonds, oranges, tomatoes, etc.) Food is cheap in the United States in part because of the invisible subsidy of cheap water for agriculture. Farmers pay much lower water rates for the same water as cities.

furrow irrigation with water
However, what California does about their water crisis will impact the rest of the United States. The economy of California based on control of the water and the allocation is based on regulatory decisions. The water supply has failed to match the demand for a product with no real price. According to University of California at Davis the drought will cost the state $2.2 billion lost from to the agricultural economy of the state. While a large number it is but a small fraction of the almost $2 trillion California State economy.
furrow irrigated fields without water
The demand for and use of water must be reduced or the supply increased. There are limited choices: Reduce the acreage of cultivated land by buying out farmers and their water rights and allocations. With water restrictions on cities, it is not really appropriate for California farmers to essentially export subsidized water contained in almonds, apples, alfalfa, etc. to Asia. The agricultural economy  in California needs to shrink, according to work done at U.C. Davis increasing irrigation efficiency alone future water needs of the urban, commercial/industrial and environmental sectors.  If California cannot find the political will to reduce the acreage under cultivation, they could reduce the population of the state, fewer people use less water. Ration water to all citizens and businesses. Reduce the flow allocations to maintain the environment. Or find the resources to build desalination plants (the one in Carlsbad that is to be completed in 2016 is costing $1 billion). None of these are easy solutions, but neither is going from crisis to crisis.

Thursday, July 17, 2014

Mandatory Water Conservation in California

For the first time in its history California has instituted mandatory water use restrictions. After three years of below-normal rainfall, California is currently facing its third most severe drought in recorded history; however, water usage in California is significantly higher than in previous droughts, the rainy season has finished, and the drought continues with no end in sight. Currently, all the water reservoirs in California are at less than half their capacity.

Last January Governor Jerry Brown declared a drought emergency and called for voluntarily water conservation, hoping to cut use in the urban and suburban water districts by 20%; unfortunately by May it was clear that voluntary measures had produced only a 5% savings. So, on Tuesday, the California State Water Resource Control Board approved an emergency regulation to force water agencies and urban state residents to increase their water conservation.

The new water conservation regulation primarily reduces outdoor urban water use. The regulation, adopted by the State Water Board, mandates minimum actions for water agencies and consumers to conserve water supplies both for this year and into 2015. Most Californians (like most residents of arid states) use more water outdoors than indoors, up to 50% of daily water use is estimated to be for lawns and outdoor landscaping.

Under the emergency regulation, all Californians will be required to stop: washing down driveways and sidewalks; watering of outdoor landscapes that cause excess runoff; using a hose to wash a motor vehicle, unless the hose is fitted with a shut-off nozzle, and using potable water in a fountain or decorative water feature, unless the water is recirculated. The regulation makes an exception for health and safety circumstances.

The larger water supplier’s agencies will be required to activate their Water Shortage Contingency Plan to a level where outdoor irrigation restrictions are mandatory and track progress towards their conservation goals. In smaller communities where no water shortage contingency plan exists, the regulation requires that water suppliers either limit outdoor irrigation to twice a week or implement other comparable conservation actions.

“We are facing the worst drought impact that we or our grandparents have ever seen,” said State Water Board Chairperson Felicia Marcus. “And, more important, we have no idea when it will end. This drought’s impacts are being felt by communities all over California. Fields are fallowed; communities are running out of water, fish and wildlife will be devastated. The least that urban Californians can do is to not waste water on outdoor uses. It is in their self-interest to conserve more, now, to avoid far more harsh restrictions, if the drought lasts into the future. These regulations are meant to spark awareness of the seriousness of the situation, and could be expanded if the drought wears on and people do not act.”


from UC Davis-dry irrigation systems
This past spring water allocations to farmers and ranchers were reduced based on priority of water rights. The University of California at Davis Center for Watershed Sciences study released Tuesday found that the current drought has resulted in the greatest water loss ever seen in California agriculture, with river water allocated for Central Valley farms reduced by roughly one-third. Irrigated agricultural consumes over 75% of the delivered water in California, which produces about half of U.S. grown fruits, nuts, and vegetables. As farmers have shifted to higher value horticultural and orchard crops, they have adopted more efficient irrigation technologies to stretch their water allocations, but have grown more dependent on groundwater to ensure the survival of orchards. Groundwater pumping is expected to replace a significant portion of the river water losses, with some areas more than doubling the amount of groundwater used from last year.

More than 80% of this groundwater pumping occurs in the San Joaquin Valley and Tulare Basin. California produces about half of U.S. grown fruits, nuts, and vegetables, much of it from the central valley of California where three crops a year can be grown and crop production is only limited by the amount of water delivered for irrigation, the groundwater is used to increase irrigation waters making up an estimated of 30% of water for irrigation in a “normal” year. The groundwater aquifer is predominately non-renewable.

So much water has been pumped that the land above the aquifer has subsided and can never recover. The water level in these aquifers has fallen hundreds of feet in the past few generations and according to the UC Davis report cannot be sustained. According to Jay Lund the director of the Center for Watershed Sciences to ensure that there is groundwater to carry the region thought future droughts we need to properly manage this resource. California is the only state without a framework for groundwater management.
from UC Davis- Orchards left to die