Last week the U.S. Environmental Protection Agency announced the 2014 recipients of the Greening America's Capitals grant program. Richmond, Virginia is one of the four recipients and will receive assistance to improve a one-third mile segment of Jefferson Avenue which links the Church Hill and Union Hill neighborhoods east of downtown. The other grant recipients for 2014 are Austin, Texas; Carson City, Nevada; Columbus, Ohio; and Pierre, South Dakota.
The EPA will provide design assistance from private-sector experts (consultants) to develop a sustainable design to jump start the process of creating vibrant and environmentally sustainable neighborhoods within these cities. The design team works with the community and city officials and develops a set of options for the small grant neighborhood that include plans and illustrations. By using illustrations of a new vision for the site, the design teams hope to enable the community and the city to envision what is possible; to develop new perceptions of the place, see the potential, react to it, and energize implementation efforts within the community. In public workshops, the design team gathers input from the residents of the communities to include their ideas and values into the designs.
Greening America’s Capitals helps state capitals develop an achievable vision of distinctive, environmentally friendly neighborhoods that incorporate innovative green infrastructure strategies. Hopefully these programs will not end up displacing the community residents, but improving the existing community-though that has never been accomplished. The Greening America’s Capitals program is part of a collaboration among EPA, the U.S. Department of Housing and Urban Development (HUD), and the U.S. Department of Transportation (DOT) through the HUD‐DOT‐EPA Partnership for Sustainable Communities where EPA provides design assistance to help support sustainable communities that protect the environment, economy, and public health with hopes to inspire state leaders to expand this work elsewhere within the states.
Design options presented for all the Greening America’s Capital cities typically provide environmental benefits by adding things commonly thought of as “green” such as trees and rain gardens, community benefits by creating new transportation options (bike paths, mass transit access) and gathering places for residents and visitors, and economic benefits by encouraging private investment in the local economy.
Green infrastructure, a strategy of stormwater management emphasizing natural features to mimic as closely as possible the natural hydraulic properties of a site, is an integral element of the Sustainable Communities programs. Stormwater management seems to be the one environmental concern shared by all the capital cities in the program, past and present. The design options prepared for past recipients have included curbside rain gardens and permeable paving to collect and filter runoff from streets and roofs. The rain gardens have the added benefit of making the street more attractive and safer for pedestrians by buffering them from traffic. The designers of other city plans hope that this will bring new life to the street and attract private investment.
Reducing paved surfaces and adding trees could also reduce the heat island effect—the increase in ambient air temperature caused by radiant heat from dark, paved surfaces and allow for better water infiltration. Green infrastructure mimics natural systems by utilizing permeable surfaces to absorb storm water back into the ground (infiltration), using trees and other natural vegetation to convert it to water vapor (evapotranspiration) and using rain barrels or cisterns to capture and reuse storm water. These natural processes manage storm water runoff in a way that maintains or restores the site’s natural hydrology, allowing groundwater to recharge. Site-level green infrastructure, rain gardens, porous pavements, green roofs, infiltration planters, trees and tree boxes and rainwater harvesting for landscape irrigation, not only reduces the velocity and quantity of runoff protecting our streams, rivers, lakes and estuaries, it allows the recharge of groundwater and improves the site’s ambience.
Under the Clean Water Act, the National Pollutant Discharge Elimination System (NPDES) Permit Program controls water pollution by regulating point sources that discharge pollutants into rivers in the United States. Stormwater systems are subject to the permit program. The EPA’s Greening America’s Capitals program which encourages green infrastructure to manage storm water is inconsistent with permit requirements under NPDES that call for more conventional methods of stormwater management, but one of the goals of this program is to begin changing that. Investments in stormwater management and wastewater treatment plants are driven by compliance with regulations and permits and have not really allowed local policy makers to implement watershed-based or decentralized green infrastructure solutions that may not yet have the data necessary to demonstrate performance and receive regulatory “credit” under a NPDES permit.
Within the Chesapeake Bay Watershed, of which Richmond is part, the Chesapeake Bay Model provides credit under the Watershed Implementation Plans for green infrastructure retrofits, but not all practices are believed to be credited appropriately (both because of the amount of time needed for these practices to show long-term performance, as well as limitations in historic data collection). Nonetheless, the model does give credit for Urban Best Management practices which include all the elements of green infrastructure, including; urban tree planting, porous pavements, urban wet ponds, vegetated open channels, urban stream restoration, and various water infiltration “practices” that require ongoing maintenance and replacing as needed of the plants after severe winters or prolonged droughts, weeding, and clearing of porous pavements. We do not yet have a method of ensuring that these features are maintained appropriately to continue functioning over time and that any repairs or replacements are done with green infrastructure in mind to insure that these practices work over time to reduce stormwater runoff.
A third of a mile is a tiny little piece of Richmond. Nonetheless, green infrastructure and sustainable communities are the way of the future for Virginia and much of the nation. The Greening America’s Capitals grant is a wonderful way for Virginia to take the first step forward -benefiting from the experience of other cities. Take a look at the work that was done for the Washington DC 2010 grant.
Monday, September 29, 2014
Thursday, September 25, 2014
When to Pump Your Septic Tank
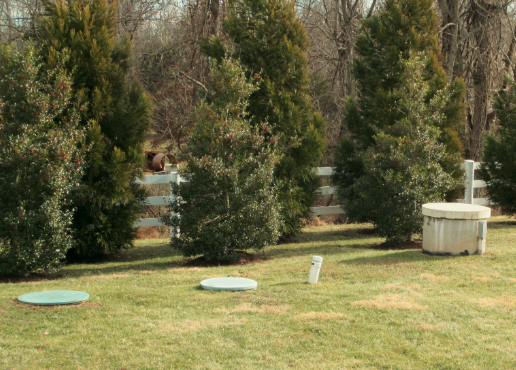
Generally speaking the more frequently you pump your tank the longer your septic system will continue to function properly and the better it is for the environment and your health. The most likely cause of E. coli bacteria in your well is you own septic system. The nutrient pollution that feeds algae blooms, creates dead zones, or toxic algae threats to drinking water supplies is from fertilizers applied to crops and lawns, animal waste both domestic and agricultural and human waste from inadequately treated sewage from waste water treatment plant overflows and improperly maintained and operated septic systems. The U.S. Environmental Protection Agency, EPA, estimates that 25% of households in the United States depend on a septic system- and that adds up.
Back in the day and still in many parts of the country there were no requirements to pump your septic tank. Where I live in the here and now I am required by a local environmental regulation to pump my septic tank every 5 year. That might be just fine for my two person household with a big tank, but is woefully inadequate for my neighbor with 10 people in their household in addition to operating a home based business with employees. The estimated needed frequency for pump outs based on the size of septic tank and number of people appears below and is based on work done at Penn State University Extension. The U.S. Environmental Protection Agency would like to see all septic tanks pumped out every three years.

In reality how often a tank needs to be pumped depends on the size of the tank, the number of people living in the house and the habits of the people in the house and the types of soil in the drainfield. People who are home all day put more load on a house than those who work away from the home or go to school. Flushable wipes and other things flushed down the toilet add build up to the tank; they do not dissolve and disappear, despite packaging that says septic safe.
Having a garbage disposal that is used is the equivalent of having another person or two living in the house. The garbage disposal works by grinding up food scraps. Though some of these materials can be broken down by bacterial action, because the food is not predigested like human waste it is mostly inert and either sinks to the bottom of the tank and will have to be pumped out, or remains in suspension and is carried over to the drainfield or other final treatment and ultimately clogs the system. The same is true for the grinders in dishwashers. If you do not have to clean out the filter, then it’s in your septic tank.
Water softeners are another potential problem. Water softening systems work by using a salt solution to start the ion exchange with the calcium carbonate and magnesium. The softener has to be back washed to regenerate the ion exchange medium and the system flushes pounds of the used salt in the 15-30 gallons of the backwash solution into the septic system. Septic service companies that belong to the Small Flows Clearinghouse have reported observed negative impact from water softening regeneration brines including pipes clogged by a “noxious fibrous mass” only reported in homes with softening systems and deterioration on the permeability of the drainfield or other septic dispersion system.
It is SepticSmart Week.
Monday, September 22, 2014
Earthquakes and Water- the Earth’s Plumbing System
In the throes of the worst California drought in recent history rivers and streams across California had been flowing at record low level and some streams were completely dry. Then late August a magnitude 6.0 earthquakes hit the South Napa Valley and a funny thing happened; water began to flow again in some previously dry creaks, rivers and streams. For decades scientists have noted that there is a hydrogeologic response to earthquakes, but understanding of this response is still very limited. In the case of the South Napa Earthquake the flow of springs and groundwater to some streams appears to has increased. Scientists at the U.S. Geological Survey (USGS) predict that based on the experience in previous earthquakes the stream and sprig flows will decline again over the next several months if the rains do not return to California.
Hydro-geologic responses to earthquakes have been observed to occur both in the area of the earthquake and thousands of miles from the earthquake epicenter. Earthquakes impact groundwater the most commonly observed impact is to water wells. Some well have been observed to become turbid or muddy, some have run dry or had an increase in flow or water level. New springs have formed and the quality of groundwater and surface water has changed. Some of these changes are transitory others appear to be permanent and only time can tell the difference between them. In addition, there have also been surface water responses to earthquakes. Surface-water responses to earthquakes include changes in chemistry, wave oscillations in lakes, increases and sometime decreases in stream, spring, and seep discharge, instances of springs going dry or the appearance of new springs.
According to the USGS the water-level fluctuates in wells in response to seismic waves. The occurrence and size of the water level response of water wells to earthquakes are influenced by a variety of factors such as the magnitude and depth of the earthquake, the distance of the well from the epicenter, the geology surrounding the well, the depth of the well, whether the aquifer is confined or unconfined and the well construction. The most common observed groundwater response to an earthquake is an instantaneous water level offset or step up. An instantaneous increase or decrease in water level. This response is commonly observed because there are hundreds of wells used to monitory water levels nationally. The change and recovery in water level can be so rapid that it is barely detectable, or it may take minutes, hours, days, or months for a well to return to previous water levels. There have also been instances where the well never returned to pre-earthquake levels.
Lots of things can impact the response of a well to a seismic event and scientists cannot predict which wells will be impacted and whether the impact is permanent or transitory. The USGS reports that within 3 months of the 1998 magnitude 5.2 earthquake in northwestern Pennsylvania that over a hundred private water wells in the area went permanently dry. The 2002 Alaskan Denali Fault earthquake which was a magnitude 7.9 caused a 2-foot water-level rise in a well in Wisconsin, more than a thousand miles from the epicenter. That rise also appears to be permanent.
What is clear is that groundwater aquifers systems are mechanically connected to the rocks and sediments in which they exist. In addition to hydrogeologic responses to earthquakes, hydrogeologic changes may cause earthquakes or volcanic events. Earthquakes can be induced by the filling of surface reservoirs, or by annual or shorter-term fluctuations in reservoir levels. In addition, earthquakes can be induced by the deep well injection (or withdrawal) of fluids as has been seen in the disposals in the 1960’s at the Rocky Mountain Arsenal and more recently in disposal of the waste fracking fluid from hydraulic fracking.
The USGS says that water level offsets in the area of an earthquake because the earthquake “subjects the earth’s crust and its aquifer systems, to stress and permanent strain (deformation). This deformation process results in altered fluid pressure within the aquifer systems, and consequently, a step like change in water level would be expected.” The USGS cites various mechanisms for well water responses based on type of geology. For increased water level in shallow wells, the USGS suggests that compaction of overlying alluvium similar to liquefaction may be the mechanism producing the offset. Fluid-pressure declines are suggested to be caused by the escape of small amounts of dissolved gas from pore spaces in the aquifer in response to seismic waves. In a fractured rock system like the one here and in northwestern Pennsylvania where the wells went dry, permeability of the ground may be changed by the unclogging, widening, or narrowing of fractures, or the creation of new fractures. Similarly, an increase in ground-water discharge though springs, seeps, or to streams could be caused by an increase in the subsurface fluid pressure or permeability of the geologic formation.
There have also been several instances of reported changes in water levels in well before an earthquake. Many of these documented cases come from seismically active Japan where they continue to search for predictors of earthquakes. Many scientists do not believe that groundwater and well response can be used to predict earthquakes; they believe that there are too many other explanations for well water changes. Truthfully in the last couple of years (in my volunteer work with the VAMWON) I’ve seen several instance of what I think of as transitory benign well response where a well level falls dramatically and then recovers seemingly unconnected to precipitation and use. I have also seen transitory turbidity that just seems to pass through and then the well returns to normal. There are many potential explanations for these observations, so I simply note them and test the water quality when it returns to normal to make sure it is safe to drink.
However these episodes make you think about how interconnected the groundwater system is to the earth. Recently Dr. Robert Jackson et al. published an analysis of all the peer reviewed research done on hydraulic fracking. Though there has been documented impact to groundwater from improperly constructed wells, there has been no confirmed impact to groundwater from fracking itself. Rather than testing for direct chemical contamination in areas surrounding a hydraulic fracking maybe scientist should be looking for changes in water quality and quantity in nearby groundwater wells and systems that are more typical in seismic events.
For more information on stream flow and water well responses to earthquakes and discussion of potential mechanisms see research from Department of Earth and Planetary Science, University of California, at Berkeley by Chi-Yuen Wang, Michael Manga and others.
 |
| from USGS |
According to the USGS the water-level fluctuates in wells in response to seismic waves. The occurrence and size of the water level response of water wells to earthquakes are influenced by a variety of factors such as the magnitude and depth of the earthquake, the distance of the well from the epicenter, the geology surrounding the well, the depth of the well, whether the aquifer is confined or unconfined and the well construction. The most common observed groundwater response to an earthquake is an instantaneous water level offset or step up. An instantaneous increase or decrease in water level. This response is commonly observed because there are hundreds of wells used to monitory water levels nationally. The change and recovery in water level can be so rapid that it is barely detectable, or it may take minutes, hours, days, or months for a well to return to previous water levels. There have also been instances where the well never returned to pre-earthquake levels.
Lots of things can impact the response of a well to a seismic event and scientists cannot predict which wells will be impacted and whether the impact is permanent or transitory. The USGS reports that within 3 months of the 1998 magnitude 5.2 earthquake in northwestern Pennsylvania that over a hundred private water wells in the area went permanently dry. The 2002 Alaskan Denali Fault earthquake which was a magnitude 7.9 caused a 2-foot water-level rise in a well in Wisconsin, more than a thousand miles from the epicenter. That rise also appears to be permanent.
 |
| From USGS |
The USGS says that water level offsets in the area of an earthquake because the earthquake “subjects the earth’s crust and its aquifer systems, to stress and permanent strain (deformation). This deformation process results in altered fluid pressure within the aquifer systems, and consequently, a step like change in water level would be expected.” The USGS cites various mechanisms for well water responses based on type of geology. For increased water level in shallow wells, the USGS suggests that compaction of overlying alluvium similar to liquefaction may be the mechanism producing the offset. Fluid-pressure declines are suggested to be caused by the escape of small amounts of dissolved gas from pore spaces in the aquifer in response to seismic waves. In a fractured rock system like the one here and in northwestern Pennsylvania where the wells went dry, permeability of the ground may be changed by the unclogging, widening, or narrowing of fractures, or the creation of new fractures. Similarly, an increase in ground-water discharge though springs, seeps, or to streams could be caused by an increase in the subsurface fluid pressure or permeability of the geologic formation.
There have also been several instances of reported changes in water levels in well before an earthquake. Many of these documented cases come from seismically active Japan where they continue to search for predictors of earthquakes. Many scientists do not believe that groundwater and well response can be used to predict earthquakes; they believe that there are too many other explanations for well water changes. Truthfully in the last couple of years (in my volunteer work with the VAMWON) I’ve seen several instance of what I think of as transitory benign well response where a well level falls dramatically and then recovers seemingly unconnected to precipitation and use. I have also seen transitory turbidity that just seems to pass through and then the well returns to normal. There are many potential explanations for these observations, so I simply note them and test the water quality when it returns to normal to make sure it is safe to drink.
However these episodes make you think about how interconnected the groundwater system is to the earth. Recently Dr. Robert Jackson et al. published an analysis of all the peer reviewed research done on hydraulic fracking. Though there has been documented impact to groundwater from improperly constructed wells, there has been no confirmed impact to groundwater from fracking itself. Rather than testing for direct chemical contamination in areas surrounding a hydraulic fracking maybe scientist should be looking for changes in water quality and quantity in nearby groundwater wells and systems that are more typical in seismic events.
For more information on stream flow and water well responses to earthquakes and discussion of potential mechanisms see research from Department of Earth and Planetary Science, University of California, at Berkeley by Chi-Yuen Wang, Michael Manga and others.
Thursday, September 18, 2014
Hydrofluorocarbons to be Banned
On Tuesday the White House announced the commitments by the country’s largest chemical firms and retailers to phase out R-134a and similar refrigerants compounds that are used in most air conditioning systems in offices, homes, schools and automobiles in the country.
This summer under President Obama's Climate Action Plan the U. S. Environmental Protection Agency (EPA) announced it’s proposed to ban on the use of hydrofluorocarbons (HFCs). HFCs do not exist in nature; they are entirely manmade and are used primarily as refrigerants. They came into wide use in the 1980s; as chlorofluorocarbons were being phased out under the Montreal Protocol. Chlorofluorocarbons had been found to be depleting the earth’s ozone layer. So chlorofluorocarbons were replaced with hydrofluorocarbons; however, while HFCs do not deplete the ozone layer, they are very potent greenhouse gases that do not break down in the atmosphere.
So, now the replacement is being replaced. Under the authority of the Clean Air Act, EPA’s Significant New Alternatives Policy (SNAP) Program evaluates substitute chemicals and technologies that are safe for the ozone layer. The EPA is banning hydrofluorocarbons under SNAP, though all HFC’s are safe for the ozone layer. Now, HFCs with a high global warming potential that were previously listed as acceptable by the EPA now will become unacceptable where there exists approved substitutes with a lower global warming potential.
Hydrofluocarbons are used as refrigerants, aerosol propellants, solvents, and fire retardants. The major emissions source of these compounds is their use as refrigerants in air conditioning systems in vehicles and buildings. Between 1990 and 2012 emissions of hydrofluorocarbons increased by 310% as their manufacture and use increased when they became the accepted substitute for chlorofluorocarbons. Without this HFC ban EPA projected that hydrofluorocarbons emissions will continue to significantly as demand for refrigeration and air conditioning continues to grow and as more ozone-depleting chlorofluorocarbons are replaced under the terms of the Montreal Protocol.
The Administration will be stepping up its diplomatic efforts to encourage other nations to phase out production of the potent greenhouse gas; though our influence in this arena is limited. This announcement came in advance of next week’s summit of world leaders at the United Nations to debate options for slowing the buildup of greenhouse gases in the atmosphere.
There are three main categories of fluorinated gases--hydrofluorocarbons (HFCs), perfluorocarbons (PFCs), and sulfur hexafluoride (SF6). Perfluorocarbons are compounds produced as a by-product in the manufacture of aluminum and semiconductors. Sulfur hexafluoride is used in electrical transmission equipment, including circuit breakers, magnesium processing and semiconductor manufacturing, as well as a tracer gas for leak detection; however, it is the most potent greenhouse gases that the Intergovernmental Panel on Climate Change has evaluated. Its use has been decreasing and is of less concern. Use of perfluorocarbons is expected to remain flat.
 |
| from EPA |
So, now the replacement is being replaced. Under the authority of the Clean Air Act, EPA’s Significant New Alternatives Policy (SNAP) Program evaluates substitute chemicals and technologies that are safe for the ozone layer. The EPA is banning hydrofluorocarbons under SNAP, though all HFC’s are safe for the ozone layer. Now, HFCs with a high global warming potential that were previously listed as acceptable by the EPA now will become unacceptable where there exists approved substitutes with a lower global warming potential.
Hydrofluocarbons are used as refrigerants, aerosol propellants, solvents, and fire retardants. The major emissions source of these compounds is their use as refrigerants in air conditioning systems in vehicles and buildings. Between 1990 and 2012 emissions of hydrofluorocarbons increased by 310% as their manufacture and use increased when they became the accepted substitute for chlorofluorocarbons. Without this HFC ban EPA projected that hydrofluorocarbons emissions will continue to significantly as demand for refrigeration and air conditioning continues to grow and as more ozone-depleting chlorofluorocarbons are replaced under the terms of the Montreal Protocol.
The Administration will be stepping up its diplomatic efforts to encourage other nations to phase out production of the potent greenhouse gas; though our influence in this arena is limited. This announcement came in advance of next week’s summit of world leaders at the United Nations to debate options for slowing the buildup of greenhouse gases in the atmosphere.
There are three main categories of fluorinated gases--hydrofluorocarbons (HFCs), perfluorocarbons (PFCs), and sulfur hexafluoride (SF6). Perfluorocarbons are compounds produced as a by-product in the manufacture of aluminum and semiconductors. Sulfur hexafluoride is used in electrical transmission equipment, including circuit breakers, magnesium processing and semiconductor manufacturing, as well as a tracer gas for leak detection; however, it is the most potent greenhouse gases that the Intergovernmental Panel on Climate Change has evaluated. Its use has been decreasing and is of less concern. Use of perfluorocarbons is expected to remain flat.
At the White House announcement GreenChill Partner member supermarkets reconfirmed their current commitment to transition to climate-friendly refrigerants, reduce the amount of refrigerant used, and eliminate refrigerant leaks. In addition, Target announced that it is expanding its use of HFC-free refrigeration systems, partnering with chemical producers to test the next generation of climate-friendly refrigerants, and working with a beverage cooler manufacturer to test HFC-free solutions this fall. Hillphoenix announced that it is commercializing a new, more energy efficient, HFC-free CO2 booster system, and introducing an HFC-free hydrocarbon self-contained door case. Kroger and Port Townsend Food Co-op of Port Townsend, Wash., also announced that they’ve joined the EPA’s GreenChill Partnership
Monday, September 15, 2014
Fracking-Neither Revolutionary nor Disastrous
Robert Jackson, who in 2014 became the Kevin and Michelle Douglas Professor of Environment and Energy at Stanford University, is one of the environmental scientists whose work I follow,and he has done considerable work examining the environmental impacts from fracking. Now, he and a group of co-authors published a new paper entitled: “The Environmental Costs and Benefits of Fracking” in the Annual Review of Environment and Resources.( Annu. Rev. Environ. Resour. 2014. 39:7.1–7.36) that is a fabulous summary of everything we do and do not know about the impacts of fracking.
In this paper Robert B. Jackson formerly of Duke University and now at Stanford, Avner Vengosh, still at Duke University, J. William Carey, from Los Alamos National Laboratory, Richard J. Davies, from Durham University, Thomas H. Darrah, for Ohio State University, Francis O’Sullivan, from MIT and Gabrielle P´etron from the University of Colorado at Boulder reviewed all 166 fracking studies that have been performed and peer reviewed to consolidate all that we know about fracking and identify the areas where more research needs to be performed. This paper is not a primer, but is a complete and thorough review of all the risks and benefits associated with the hydrocarbon extraction method known as fracking.
Fracking is the current method of extracting unconventional oil and natural gas that is locked inside impermeable geological formations. Fracking is enabled by horizontal drilling and hydraulic fracturing (thus the name fracking). Fracking or hydraulic fracturing as it is more properly known involves the pressurized injection of fluids made up of mostly water and chemical additives into a geologic formation. The pressure used exceeds the rock strength and the fluid opens or enlarges fractures in the rock. As the formation is fractured, a “propping agent,” such as sand or ceramic beads, is pumped into the fractures to keep them from closing as the pumping pressure is released. The fracturing fluids (water and chemical additives) are partially recovered and returned to the surface or deep well injected for disposal. Natural gas or oil will flow from pores and fractures in the rock into the wells allowing for enhanced access to the methane or oil reserves.
Over the past decade, the use of hydraulic fracturing for gas extraction has increased and has expanded over a wide diversity of geographic regions and geologic formations throughout the United States and Canada. The annual production of methane (CH4) in the United States had increased 30% from 2005 to about 30,171 billion cubic feet of gas a year. The ability to frack oil and natural gas has profoundly changed the estimates of recoverable oil and gas resources and the energy future of this century. There is now known to be adequate natural gas resources for the foreseeable future. Many countries, including Algeria, Argentina, Australia, Brazil, Canada, China, France, Libya, Mexico, Poland, Russia, South Africa, the United States, and Venezuela, are estimated to possess significant shale oil and gas reserves that are now accessible to man. Fracked oil and gas can result in an economic boom as it generates income. If fracking is done carefully and properly the safely extracted gas can reduce air pollution and even water use compared with other fossil fuels. However, the authors point out that availability of vast quantities of natural gas is likely to slow the adoption of renewable energy sources and, if fracking is done poorly toxic chemicals from fracking fluid could be released into our water supplies and methane could be release to the air.
As fracking has expanded, so has a public and regulatory concern about the possible environmental consequences of fracking and horizontal drilling. Fracking is banned in France and there is a moratorium in New York State based on health and environmental concerns. These concerns include air pollution from the operation of heavy equipment, human health effects for workers and people living near well pads from chemical exposure, noise and dust, induced seismicity from the disposal of fracking fluids, and increased greenhouse gas emissions from poor well head control and continued use of hydrocarbons. However, the biggest health and environmental concerns remains the potential for drinking water contamination from fracturing fluids, natural formation waters, and stray gases.
In the drought plagued west a significant problem is the amount of water needed to hydraulically fracture a well. On average takes 3.8 million gallons of water for each well. Though about half the water will be returned, the recovered water will contain chemical and radiological contaminants. The study found that surprisingly, shale-gas extraction and processing are less water intensive than many other forms of energy extraction. The water intensities for coal, nuclear, and oil extraction are approximately 2 times, 3 times, and 10 times greater than for shale gas, respectively. Corn ethanol production uses substantially more water because of the evapotranspiration of the plants, and 1,000 times more water than shale gas if the plants are irrigated. Conventional natural gas uses less water and renewable forms of energy such as wind and solar that consume almost no water.
Maintaining well integrity and reducing surface spills and improper wastewater disposal have been found to be the way to minimize contamination from the chemicals used in fracking fluid and from naturally occurring contaminants such as salts, metals, and radioactivity found in oil and gas wastewaters that are returned to the surface. Though, there have been few definitive studies of the frequency, consequences, and severity of well integrity failure. Studies done in Ohio and Texas found over a 25-year period on a mix of traditional and shale gas wells found an extremely low level of incidence of groundwater contamination, In Ohio they found 185 cases of groundwater contamination caused primarily by failures of wastewater pits or well integrity out of about 60,000 producing wells, for an incident rate of about 0.1%.The rate for Texas was found to be even lower at about 0.02%, The Texas study included 16,000 horizontal shale-gas wells with none reporting groundwater contamination.
A significant concern is that hydraulic fracturing could open small cracks thousands of feet underground, connecting shallow drinking-water aquifers to deeper layers and providing a pathway for the chemicals used in fracking and naturally occurring geological formational brines to migrate upward. In practice, according to Dr. Jackson and the others this is unlikely because of the depths of most (but not all) shale formations tends to be 3,000-10,000 feet below ground level, and man-made hydro-fractures rarely propagate more than 2,000 feet. According to Dr. Jackson a more plausible scenario would be for man-made fractures to connect to a natural fault or fracture, an abandoned well, or some other underground pathway, allowing fluids to migrate upward).A simpler pathway for groundwater contamination, though, is through poor well construction and integrity. In the first study to test for potential drinking-water contamination associated with unconventional energy extraction, In studies overlying the Marcellus Shale in Pennsylvania that is what they found.
The scientists found that the number of peer-reviewed studies that have examined potential water contamination is surprisingly low. Wastewater from oil and gas exploration is generally classified into flowback and produced waters. Flowback water is the fluids that are return to the surface after the hydraulic fracturing and before oil and gas production begins, primarily during the days when the well is completed. Typically it consists of 10–40% of the injected fracturing fluids and chemicals pumped underground that return to the surface mixed with an increasing proportion of natural brines from the shale formations over time. Produced water is the fluid that flows to the surface during extended oil and gas production. It primarily reflects the chemistry and geology of deep formation waters. These naturally occurring brines are often saline to hypersaline and can contain toxic levels of elements such as barium, arsenic, and radioactive radium.However, more work needs to be done to understand fracking’s impact and gather the data necessary for improved geomechanical models for how hydraulic fracturing affects the wellbore environment and how fluids move through rock formations.
It is not clear to scientists if hydraulic fracturing has contaminated drinking water directly. In Pavillion, Wyoming, where EPA’s initial results were thought to be evidence that fracking contributed to water pollution. State regulators and industry officials questioned those initial results due to the lack of predrilling data and presence of historic wells at the site. While it is clear that the drinking water aquifer has been impacted the cause is not clear. While glycols, alcohols, methane and benzene were found in a well the EPA drilled into the drinking water aquifer, these products can naturally seep into groundwater wells. This is a rare occurrence that is usually confined to deeper water wells in the coal-producing areas, but these were deeper wells in a coal producing area, and contamination could have been introduced into the water by previous generations of oil and gas development. Hydraulic fracturing in this tight sandstone formation occurred as shallowly as 322 meters. A lack of vertical separation between fracking activity and drinking water increases hydraulic connectivity and the opportunities for contamination of drinking water supplies.
Throughout their study the scientist recommend a series of research questions that should be answered to more fully model and understand fracking. In addition they emphasize the need for greater transparency from companies and regulating agencies in information and the need for baseline studies prior to drilling is critical to even know if water or human health has been impacted. Predrilling data needs to include measurements of groundwater and surface-water quality and quantity as well as air quality, and human health. The scientists pointed out that there have been virtually no comprehensive studies on the impact of fracking on human health while state regulators and law in some instances allow fracking virtually in people’s backyards.The fact that the Pavillion, Wyoming field with no vertical separation could be legally fracked highlights the problem. Fracking needs to be well understood and the risks managed to make sure that is a boon to mankind and only is used in appropriate and low risk locations.
In this paper Robert B. Jackson formerly of Duke University and now at Stanford, Avner Vengosh, still at Duke University, J. William Carey, from Los Alamos National Laboratory, Richard J. Davies, from Durham University, Thomas H. Darrah, for Ohio State University, Francis O’Sullivan, from MIT and Gabrielle P´etron from the University of Colorado at Boulder reviewed all 166 fracking studies that have been performed and peer reviewed to consolidate all that we know about fracking and identify the areas where more research needs to be performed. This paper is not a primer, but is a complete and thorough review of all the risks and benefits associated with the hydrocarbon extraction method known as fracking.
Fracking is the current method of extracting unconventional oil and natural gas that is locked inside impermeable geological formations. Fracking is enabled by horizontal drilling and hydraulic fracturing (thus the name fracking). Fracking or hydraulic fracturing as it is more properly known involves the pressurized injection of fluids made up of mostly water and chemical additives into a geologic formation. The pressure used exceeds the rock strength and the fluid opens or enlarges fractures in the rock. As the formation is fractured, a “propping agent,” such as sand or ceramic beads, is pumped into the fractures to keep them from closing as the pumping pressure is released. The fracturing fluids (water and chemical additives) are partially recovered and returned to the surface or deep well injected for disposal. Natural gas or oil will flow from pores and fractures in the rock into the wells allowing for enhanced access to the methane or oil reserves.
Over the past decade, the use of hydraulic fracturing for gas extraction has increased and has expanded over a wide diversity of geographic regions and geologic formations throughout the United States and Canada. The annual production of methane (CH4) in the United States had increased 30% from 2005 to about 30,171 billion cubic feet of gas a year. The ability to frack oil and natural gas has profoundly changed the estimates of recoverable oil and gas resources and the energy future of this century. There is now known to be adequate natural gas resources for the foreseeable future. Many countries, including Algeria, Argentina, Australia, Brazil, Canada, China, France, Libya, Mexico, Poland, Russia, South Africa, the United States, and Venezuela, are estimated to possess significant shale oil and gas reserves that are now accessible to man. Fracked oil and gas can result in an economic boom as it generates income. If fracking is done carefully and properly the safely extracted gas can reduce air pollution and even water use compared with other fossil fuels. However, the authors point out that availability of vast quantities of natural gas is likely to slow the adoption of renewable energy sources and, if fracking is done poorly toxic chemicals from fracking fluid could be released into our water supplies and methane could be release to the air.
As fracking has expanded, so has a public and regulatory concern about the possible environmental consequences of fracking and horizontal drilling. Fracking is banned in France and there is a moratorium in New York State based on health and environmental concerns. These concerns include air pollution from the operation of heavy equipment, human health effects for workers and people living near well pads from chemical exposure, noise and dust, induced seismicity from the disposal of fracking fluids, and increased greenhouse gas emissions from poor well head control and continued use of hydrocarbons. However, the biggest health and environmental concerns remains the potential for drinking water contamination from fracturing fluids, natural formation waters, and stray gases.
In the drought plagued west a significant problem is the amount of water needed to hydraulically fracture a well. On average takes 3.8 million gallons of water for each well. Though about half the water will be returned, the recovered water will contain chemical and radiological contaminants. The study found that surprisingly, shale-gas extraction and processing are less water intensive than many other forms of energy extraction. The water intensities for coal, nuclear, and oil extraction are approximately 2 times, 3 times, and 10 times greater than for shale gas, respectively. Corn ethanol production uses substantially more water because of the evapotranspiration of the plants, and 1,000 times more water than shale gas if the plants are irrigated. Conventional natural gas uses less water and renewable forms of energy such as wind and solar that consume almost no water.
Maintaining well integrity and reducing surface spills and improper wastewater disposal have been found to be the way to minimize contamination from the chemicals used in fracking fluid and from naturally occurring contaminants such as salts, metals, and radioactivity found in oil and gas wastewaters that are returned to the surface. Though, there have been few definitive studies of the frequency, consequences, and severity of well integrity failure. Studies done in Ohio and Texas found over a 25-year period on a mix of traditional and shale gas wells found an extremely low level of incidence of groundwater contamination, In Ohio they found 185 cases of groundwater contamination caused primarily by failures of wastewater pits or well integrity out of about 60,000 producing wells, for an incident rate of about 0.1%.The rate for Texas was found to be even lower at about 0.02%, The Texas study included 16,000 horizontal shale-gas wells with none reporting groundwater contamination.
A significant concern is that hydraulic fracturing could open small cracks thousands of feet underground, connecting shallow drinking-water aquifers to deeper layers and providing a pathway for the chemicals used in fracking and naturally occurring geological formational brines to migrate upward. In practice, according to Dr. Jackson and the others this is unlikely because of the depths of most (but not all) shale formations tends to be 3,000-10,000 feet below ground level, and man-made hydro-fractures rarely propagate more than 2,000 feet. According to Dr. Jackson a more plausible scenario would be for man-made fractures to connect to a natural fault or fracture, an abandoned well, or some other underground pathway, allowing fluids to migrate upward).A simpler pathway for groundwater contamination, though, is through poor well construction and integrity. In the first study to test for potential drinking-water contamination associated with unconventional energy extraction, In studies overlying the Marcellus Shale in Pennsylvania that is what they found.
The scientists found that the number of peer-reviewed studies that have examined potential water contamination is surprisingly low. Wastewater from oil and gas exploration is generally classified into flowback and produced waters. Flowback water is the fluids that are return to the surface after the hydraulic fracturing and before oil and gas production begins, primarily during the days when the well is completed. Typically it consists of 10–40% of the injected fracturing fluids and chemicals pumped underground that return to the surface mixed with an increasing proportion of natural brines from the shale formations over time. Produced water is the fluid that flows to the surface during extended oil and gas production. It primarily reflects the chemistry and geology of deep formation waters. These naturally occurring brines are often saline to hypersaline and can contain toxic levels of elements such as barium, arsenic, and radioactive radium.However, more work needs to be done to understand fracking’s impact and gather the data necessary for improved geomechanical models for how hydraulic fracturing affects the wellbore environment and how fluids move through rock formations.
Throughout their study the scientist recommend a series of research questions that should be answered to more fully model and understand fracking. In addition they emphasize the need for greater transparency from companies and regulating agencies in information and the need for baseline studies prior to drilling is critical to even know if water or human health has been impacted. Predrilling data needs to include measurements of groundwater and surface-water quality and quantity as well as air quality, and human health. The scientists pointed out that there have been virtually no comprehensive studies on the impact of fracking on human health while state regulators and law in some instances allow fracking virtually in people’s backyards.The fact that the Pavillion, Wyoming field with no vertical separation could be legally fracked highlights the problem. Fracking needs to be well understood and the risks managed to make sure that is a boon to mankind and only is used in appropriate and low risk locations.
Thursday, September 11, 2014
The Farm Bill and Hunger in America
 |
| from USDA |
 |
| from CBO |
In the 1930’s the Great Depression followed by a severe and extended drought caused widespread hardship in rural America. The demand (in America and for export) for crops and livestock fell and then the drought hit. Millions of acres that had been plowed up to grow crops were dry and barren. The native vegetation that had historically held the soil in place during droughts was gone. The Great Plains of America experienced massive erosion characterized by dust storms that reached the east coast. This devastation caused the most significant migration in American history out of the mid-west. At the time the United States was predominately an agricultural nation and in response Congress passed a series of bills on soil conservation, crop insurance, farm price supports and nutrition assistance. In the 1930’s farm policy was characterized by attempts to fix prices or quantities of food grown or improve the rural economy. All of which pretty much failed. Subsequent attempts at managing the agricultural sector saw no greater success.
Nonetheless, every five years with changing goals and details Congress has managed to pass a new farm bill. The ability to pass the Farm Bill is due mostly due to the coalition created by including nutritional assistance in the farm bill. The various farm bills generally cover five areas:
- Loans. Farmers borrow funds from the government using their future harvest as collateral. The farm bill specifies the rates on the loans and if the market price is below the loan rate, farmers deliver the crop in lieu of payment.
- Commodity Payments. There are several types of payments given to farmers to provide income support. These tend to be for grains and commodities not fruits and vegetables and are paid based on historical production. These payments are made to the farmers who receive them whether or not the crops are grown. There are also price support payments that come into play if market prices are below target prices in the legislation.
- Conservation Reserve Allocation. The Farm Bill authorizes a certain number of acres of farmland that can be taken out of production and put to conservation purposes for a period of 10 years. Landowners are paid annually for these fallow acres. Eligible lands are generally degraded or fragile lands and the program is intended to protect the soil from erosion and the streams from herbicide, pesticide, fertilizer and soil laden runoff.
- Crop insurance. In recent farm bills crop insurance has become more important. The government subsidizes the cost of insurance to protect farmers from the risks of weather and price fluctuations.
- Supplemental Nutrition Assistance. Food stamps provide financial assistance to poor families. In 2012 47 million people received food stamps. Though in its earliest form the government handed out the excess food bought from farmers, today the program is financial providing up to $167 per month per person.
In each generation of congress the Farm Bill has changed and morphed. The historical favoring of grain crops impacted the make-up of the American diet. These days food stamps and the nutritional assistance programs represent 70-75% of the $145 billion budget. Payment to farmers in the form of direct payments, deficiency payments from the loan program and insurance payments account for about 13% of the budget. Conservation programs account for about 7% and all other programs account for 6% of the budget. Some of these agricultural other programs are really important to the future of food in America, but also tucked into the budget of the Department of Agriculture are a portion of the government support for the crop-based bio-fuels ($320 million) and funding for Climate Centers. The small amount of funding for biofuels belies its impact. Biofuels and the Renewable Fuels Standard (RFS) created under the Energy policy Act of 2005 have had a profound impact on agriculture in America and the costs of the farm programs.
Since passage of the Renewable Fuels Standard corn acreage in the United States increased by almost 30%, replacing other crops and removing land from the conservation reserves program. Corn prices rose from $2.42 to almost $7 a bushel in 2012; however, last week the price of corn has fallen to about $3.35 a bushel. The USDA is predicting a 14.03 billion bushel corn crop this year, despite farmers planting fewer acres this year than last. Perfect weather is producing a bumper crop and the demand for corn is down. In recent years about 40% or so of the corn crop has gone to the production of ethanol under the RFS. But the Environmental Protection Agency, (EPA) has indicated that they will propose to cut the RFS for 2014. This is a response to the fixed volume of ethanol that is required under the RFS. Annual U.S. gasoline use has declined from its 142-billion-gallon peak in 2007 to about 133 billion gallons in 2012 and ethanol now represents 9.74% of gasoline. There appears to be a practical limit of 10% of ethanol in gasoline.
The food stamp programs provides a safety net for low-income households in times of high or volatile food prices that are often caused by the bio-fuels program and the agricultural programs themselves. It is unclear if the coalition created by combining food stamp programs and farm subsidies can survive in 21st century America where the agricultural economy employs so few. In addition, new “critical” issues are driving our nation’s food policy. Nutrient pollution and algae blooms in our nation’s water supplies, genetically modified organisms, obesity, climate change, immigration are all impacting farm policy. What is clear is that one in six American households is classified as having food insecurity. By this measure our policies have failed. It is inexcusable that there is hunger in America.
 |
| from USDA |
Monday, September 8, 2014
Protect Our Groundwater
Tomorrow, September 9, 2014, is national Protect Your Groundwater Day. This annual event is sponsored by the National Groundwater Association to raise awareness of what you can do to prevent groundwater contamination. However, groundwater is also in danger from unsustainable use during droughts, changing rain and snowfall patterns or from overuse.
The L. A. Times recently reported that hundreds of private drinking water wells in California have run dry. Tulare County is delivering water to hundreds of residents because their wells are dry and they are without water. The water level in the Central Valley has fallen and wells have gone dry from a combination of extended drought and unsustainable use of the groundwater. There is no easy or cheap solution to a dry well and groundwater in California is a limited resource. Though surface water is allocated in California based on a series of rights, there is no management of groundwater in California or much of the country. Protecting groundwater resources includes ensuring we use the resource sustainability.
If your water is supplied by a well, you also need to be aware of the factors that impact your water supply and respond to them, making sure to live within your water budget. There are dry years and wet years and you need to know which you are in. Direct determination of the groundwater level in your well requires a water level meter which can cost hundreds of dollars, but the condition of the aquifer can be obtained from a proxy well. The U.S. Geological Survey maintains monitoring wells throughout the nation and you can often gain important information from these wells. However, there is little you can do to prevent neighbors from using the groundwater for irrigation or even to encourage reducing water use during a drought. During drought groundwater use increases. As a nation we use over 75 billion gallons of groundwater each day. Irrigation is typically the largest user of this water. Techniques and frameworks for managing groundwater resources are still evolving.
I am one of the 13.2 million U.S. households whose water is supplied by a private well. In addition, there are 107,848 community supply groundwater wells that supply water to 40,301 community public water systems. The National Ground Water Association reports that 44 % of the U.S. population depends on groundwater for its drinking water supply from either a public source or private well. Since many public water system draw all or part of their supply from groundwater, protecting groundwater from contamination protects the water supply and impacts the costs for water purification and treatment. There was a time when groundwater was considered to be free from contamination, but that is no longer true. As population density increases and we use more and more chemicals, pesticides and drugs, there are more opportunities to contaminate our groundwater.
While community wells are required to test their water under the Safe Drinking Water Act, if you have your own well, then the responsibility for ensuring that your family and friends are drinking safe water rests with you. Just because your water appears clear doesn’t necessarily mean it is safe to drink. You cannot taste bacterial contamination from human and animal waste, nor nitrate/ nitrite contamination. Many chemical contaminants cannot be tasted or smelled at levels that can impact your health. The National Groundwater Association recommends that all drinking water wells should be tested for Coliform bacteria and E Coli annually. Testing is the only way to detect contamination in your water. Testing is not mandatory, but should be done to ensure your family’s safety.
Groundwater comes from rain water and snow melt percolating into the ground. Typically, the deeper the well the further away is the water origination and the older the water. The groundwater age is a function of local geology, the amount of precipitation and the rate that water is pumped out of the aquifer. Geology also determines the ease with which water and contaminants can travel through an aquifer; microorganisms in the soil and from wildlife and spilled chemicals or contaminated runoff can travel into groundwater supplies through cracks, fissures, and other pathways of opportunity like fractured rock systems. The land surface through which groundwater is recharged must remain open and uncontaminated to maintain the quality and quantity of groundwater.
Nitrate concentrations are often elevated in shallow groundwater because of agricultural and suburban development. Bacteria and nitrate contamination to groundwater can be caused by human and animal waste. Poorly managed septic systems, horses, backyard poultry can cause contaminate groundwater by overwhelming the ability of the soil to filer these contaminants or finding an opportunistic pathway through a fissure or other geological entry. An emerging concern in recent years has been the occurrence of pharmaceuticals and personal care products in septic waste water. Nitrate contamination can serve as a proxy for other trace contaminants in septic systems. Heavy local use of pesticides for ornamental gardens or farms, buried waste, and leaks from underground fuel tanks can be sources of contamination.
Households can introduce solvents, motor oil, and paint; paint thinner, water treatment chemicals and others substances by spilling them, or pouring chemicals into the ground or down the drain into a septic system. Groundwater protection depends on the entire community. The National Groundwater Association recommends: That everyone store hazardous household substances safely in a sealed container in a secure place and use hazardous substances only according to the manufacturer’s recommendations. Hazardous substances should be disposed of safely and properly. Be mindful of your water use, install WaterSense fixtures and limit exterior water use. If you own water well, make sure that all possible contamination sources are a safe distance from the wellhead (50-100 feet), make sure your septic system is operating and maintained properly and is regularly inspected and the tank is regularly pumped. Also, test your water annually.
The L. A. Times recently reported that hundreds of private drinking water wells in California have run dry. Tulare County is delivering water to hundreds of residents because their wells are dry and they are without water. The water level in the Central Valley has fallen and wells have gone dry from a combination of extended drought and unsustainable use of the groundwater. There is no easy or cheap solution to a dry well and groundwater in California is a limited resource. Though surface water is allocated in California based on a series of rights, there is no management of groundwater in California or much of the country. Protecting groundwater resources includes ensuring we use the resource sustainability.
If your water is supplied by a well, you also need to be aware of the factors that impact your water supply and respond to them, making sure to live within your water budget. There are dry years and wet years and you need to know which you are in. Direct determination of the groundwater level in your well requires a water level meter which can cost hundreds of dollars, but the condition of the aquifer can be obtained from a proxy well. The U.S. Geological Survey maintains monitoring wells throughout the nation and you can often gain important information from these wells. However, there is little you can do to prevent neighbors from using the groundwater for irrigation or even to encourage reducing water use during a drought. During drought groundwater use increases. As a nation we use over 75 billion gallons of groundwater each day. Irrigation is typically the largest user of this water. Techniques and frameworks for managing groundwater resources are still evolving.
 |
| from USGS |
While community wells are required to test their water under the Safe Drinking Water Act, if you have your own well, then the responsibility for ensuring that your family and friends are drinking safe water rests with you. Just because your water appears clear doesn’t necessarily mean it is safe to drink. You cannot taste bacterial contamination from human and animal waste, nor nitrate/ nitrite contamination. Many chemical contaminants cannot be tasted or smelled at levels that can impact your health. The National Groundwater Association recommends that all drinking water wells should be tested for Coliform bacteria and E Coli annually. Testing is the only way to detect contamination in your water. Testing is not mandatory, but should be done to ensure your family’s safety.
Groundwater comes from rain water and snow melt percolating into the ground. Typically, the deeper the well the further away is the water origination and the older the water. The groundwater age is a function of local geology, the amount of precipitation and the rate that water is pumped out of the aquifer. Geology also determines the ease with which water and contaminants can travel through an aquifer; microorganisms in the soil and from wildlife and spilled chemicals or contaminated runoff can travel into groundwater supplies through cracks, fissures, and other pathways of opportunity like fractured rock systems. The land surface through which groundwater is recharged must remain open and uncontaminated to maintain the quality and quantity of groundwater.
Nitrate concentrations are often elevated in shallow groundwater because of agricultural and suburban development. Bacteria and nitrate contamination to groundwater can be caused by human and animal waste. Poorly managed septic systems, horses, backyard poultry can cause contaminate groundwater by overwhelming the ability of the soil to filer these contaminants or finding an opportunistic pathway through a fissure or other geological entry. An emerging concern in recent years has been the occurrence of pharmaceuticals and personal care products in septic waste water. Nitrate contamination can serve as a proxy for other trace contaminants in septic systems. Heavy local use of pesticides for ornamental gardens or farms, buried waste, and leaks from underground fuel tanks can be sources of contamination.
Households can introduce solvents, motor oil, and paint; paint thinner, water treatment chemicals and others substances by spilling them, or pouring chemicals into the ground or down the drain into a septic system. Groundwater protection depends on the entire community. The National Groundwater Association recommends: That everyone store hazardous household substances safely in a sealed container in a secure place and use hazardous substances only according to the manufacturer’s recommendations. Hazardous substances should be disposed of safely and properly. Be mindful of your water use, install WaterSense fixtures and limit exterior water use. If you own water well, make sure that all possible contamination sources are a safe distance from the wellhead (50-100 feet), make sure your septic system is operating and maintained properly and is regularly inspected and the tank is regularly pumped. Also, test your water annually.
Thursday, September 4, 2014
California Water Use
 |
| from the CA Department of Water |
Every five years the U.S. Geological Survey (USGS) compiles and publishes national water-use estimates for each state and the United States as a whole. Over time these snapshots of water use can identify trends within the states. In response to the severe drought in California, the worst in modern records, the USGS has released the 2010 water-use estimates for California early- ahead of the other states. These water-use estimates are important to state regulators and water managers who use the data as inputs to their hydrologic models that they use for water resource planning and management. The water use estimates combined with the hydrologic models can help water managers, regulators and elected officials assess the changing demographics, land use, irrigation practices, climate, and water availability impact water use and the economy of the state. So, hot off the presses here is what the 2010 data shows.
Total waster use in California fell from 2005 to 2010. According to the USGS, 38 billion gallons per day (42,000,000 acre-feet per year) of water were withdrawn from groundwater and surface-water sources in 2010 while 46 billion gallons per day (52,000,000 acre-feet per year) in 2005. Overall, water use in California decreased by 17%. In 2010, Californians withdrew an estimated total of 38 billion gallons per day (42,000,000 acre-feet per year), 25 billion gallons per day (28,000,000 acre-feet per year or 67%) were supplied by surface water and 13 billion gallons per day (15,000,000 acre-feet per year or 33%) was supplied by groundwater. In 2005 35 billion gallons per day (39,000,000 acre-feet per year or 76%) was supplied by surface water and 11 billion gallons (12,000,000 acre-feet per year or 24%) was supplied by groundwater. California has increased their dependence on groundwater between the two dates, but that could have been caused by the lingering effects of the 2007-2009 drought. In California 2005 was in the middle of the last wet period.
 |
| from USGS |
The California drought of 2007-2009 was ending in 2010, however while most farmers in the Central Valley got their full federal water allotment that year, the west side of the San Joaquin Valley did not receive full water allocations. The state water project allocation remained well below normal that year. At the time the state officials attributed the reduction in a wet year to strict pumping curbs in the Sacramento-San Joaquin Delta, to protect salmon and smelt populations, and because Oroville has been slower to refill than some other reservoirs. The increased use of groundwater between 2005 and 2010 could be a trend or it could simply be that groundwater was used to make up the shortfall by the farmers in the west side of the San Joaquin Valley. The variations in rainfall that California experiences allow the state to struggle from wet period to wet period without planning for the future.
 |
| from USGS |
A significant portion of the 17% reduction in daily water use between 2005 and 2010 was from a reduction in thermoelectric water use. Only about 82% of water withdrawals, or 31 billion gallons a day in 2010 were fresh water, the rest was saline water. In California 95% of saline water withdrawals are used for thermoelectric generation (most of the rest for aquaculture). In 2005 72% of water withdrawals or 33 billion gallons a day were freshwater. Thus, from 2005 to 2010 freshwater use fell 6% in California. In both 2005 and 2010, about 74% of all fresh water withdrawals were for irrigation so most of the reduction in freshwater withdrawals was in irrigation allocations and probably an increase in water reuse in urban centers.
The 38 billion gallons per day (42,000,000 acre-feet per year) of withdrawals in 2010 were distributed among eight categories:
- Irrigation: 61% (23,000 million gallons per day, or 26,000,000 acre-feet per year).
- Thermoelectric power generation: 17% (6,600 million gallons per day, or 7,400,000 acre-feet per year). This water is saline and not usable for irrigation or consumption.
- Public supply: 17% (6,300 million gallons per day, or 7,100,000 acre-feet per year). Average daily gross per capita use was 181 gallons, this is very high individual use probably attributed to outdoor use- watering all those suburban lawns.
- Aquaculture: 3% (970 million gallons per day, or 1,100,000 acre-feet per year).
- Industrial: 1% (400 million gallons per day, or 450,000 acre-feet per year).
- Mining: 0.5% (270 million gallons per day, or 300,000 acre-feet per year).
- Livestock: 0.5% (190 million gallons per day, or 210,000 acre-feet per year).
- Self-supplied domestic use: < 0.5% (170 million gallons per day, or 190,000 acre-feet per year). Average daily per capita use was 69 gallons. This number is in line with per capita use in Virginia in 2005 and may only reflect that you do not water your lawn off your well.
Monday, September 1, 2014
Whose Water ?
Last Wednesday Judge O’Neill denied their request to stop the water releases ordered by the U.S. Bureau of Reclamation. In his decision the Judge noted that the potential harm to the water district and water authority from the potential loss of 25,000 acre feet of Flow Augmentation Releases (FAR) water from the potential water supply for 2015 did not outweigh the potentially catastrophic damage that seemed certain to occur to this year's salmon runs in the absence of the 2014 FAR. In his decision, Judge O'Neill cited a report from the tribal fisheries consultant that the extra water was needed to prevent an outbreak of disease from a parasite known as ICH, short for Ichthyophthirius multifiliis that attacks fish crowded together in drought conditions. The parasite was the prime killer of salmon in the 2002 drought.
The Bureau of Reclamation ordered the emergency releases after native Tribes that depend on the salmon for subsistence, ceremonial and commercial fisheries pressed the bureau to reverse an earlier decision to only release more water after a significant numbers of fish began to die. The Bureau of Reclamation has not been consistent with their standards for environmental Flow Augmentation Releases and has yet to develop a clear standard. There is the impression that the Bureau of Reclamation has not been consistent or entirely fair in their determinations. The FAR would likely mean less water stored for next year if the drought continues. The Hoopa Valley Tribe has for decades led the fight for ecologically-sufficient water releases from Central Valley Project (CVP) dams located on the Trinity River. Farmers are enraged by the release when their pleas for more water have gone unheeded. This is just the latest chapter in California’s long history of battles (often carried out in court and back rooms) over water.
Today the California Department of Water Resources (DWR) “owns” for the California state-owned State Water Project (SWP) just as the U.S. Bureau of Reclamation “owns” the federally-owned Central Valley Project (CVP) water. Together they form the largest water storage and transportation system in the world with 1,200 miles of canals and nearly 50 reservoirs. About 15 years ago the California Public Utilities Commission described the scope of the size of the system as capturing enough water to irrigate about four million acres and provide water to 23 million people. However, since then the population has grown and agriculture has expanded. Today there are reported to be more reported to be 9 million acres of prime irrigated land (though irrigating efficiency has improved greatly) and there are 38 million people and therein lies the problem.
The amount of precipitation that falls on California has not changed significantly over the last two hundred or so years. The average annual rain and snow fall produces approximately 200 million acre –feet of water (326,000 gallons per acre foot). In addition, the approximately 450 groundwater aquifers are thought to store about 800 million acre feet of water only a fraction of which is readily usable as a water supply. However, it is a mistake to think of California in terms of averages and regular cycles of precipitation. Since 1960 almost 40% of years have been drought years. The evidence from modern records and tree rings indicate alternating cycles of severe drought and heavy precipitation. The tree-ring studies indicate one 61 year drought from 1760-1820. Right now California is experiencing the most severe drought in the past century. This may be the result of a changing climate, the beginning of a long period of drought or just extreme weather. No one really knows, but the presiding belief is that California is facing a dryer future.
There has never been enough rain in California for there to be agriculture without irrigation. Even the native Californian Indian populations in the Owens Valley and the lower Colorado River used dams and earthen canals to divert water to irrigate fields, though in the Colorado River basin they relied on periodic floods rather than canals. Irrigated agriculture is believed to have evolved in California about a thousand years ago when the climate became drier. In the time of the native Californians the king salmon once could be found in abundance in the 650 miles of uninterrupted California waterways. In the age before massive dams and aqueducts, California’s rivers flowed uninterrupted into valleys, marshes, bays and the ocean. Two hundred years ago the central valley had year round streams, lakes and marshlands that expanded and contracted with the season and drought cycle.
Today, between the State Water Project and the Central Valley Project almost 80% of California’s developed water supply is used for agriculture. Of the total water supply, agriculture uses more than 52% of the total water supply in the state in a dry year, but 29 %: of the total water supply in a wet year. Agriculture cannot compete economically with the urban/industrial sector for water. Agriculture uses a large amount of water per unit of production (grapes, almonds, oranges, tomatoes, etc.) Food is cheap in the United States in part because of the invisible subsidy of cheap water for agriculture. Farmers pay much lower water rates for the same water as cities.
 |
| furrow irrigation with water |
 |
| furrow irrigated fields without water |
Subscribe to:
Posts (Atom)