Wednesday, March 29, 2023

Sustainable Water

 On Tuesday, the Committee of 100 held:

A Panel Discussion on the Quality & Quantity of

Water Resources in the Prince William Area


I was honored to be one of the Panelists along with Dr. Stanley B. Grant, Professor and Director of the Occoquan Watershed Monitoring Laboratory (OWML), Greg Prelewicz, Planning Manager at Fairfax Water, and Lazaro Gonzalez, Director of Global EHS and Sustainability, Micron Technology. Below are my comments:


As seen from space, we are the blue planet covered with water.

Yet, there is no mechanism on Earth for creating or destroying large quantities of water.

The most fascinating thing about water is that the water we have is what's been here, literally, forever- since the planet was formed 4.5 billion years ago.

Though 3% of the water on earth is fresh, only ½% of the water is available for us to use. The rest of the fresh water is locked away in ice, super deep groundwater or polluted beyond redemption.


The available supply of fresh water is renewed by the hydrologic cycle or artificially replenished by the activities of mankind.

In its most simplistic terms Rain drops fall to earth and will either evaporate, infiltrate into the soil, recharge groundwater or flow along the ground to a stream and ultimately flow into rivers and to the ocean-moving always moving.

But many activities of mankind interfere with the hydrologic cycle

The need for water is constant and grows with population and wealth

A community or society becomes unstable if water resources are inadequate to meet the needs of the community by growth in demand or reduction in supply- often both.

The Potomac River, its tributaries, reservoirs and the associated groundwater resources are the source of drinking water for the over 6,000,000 people in the Washington Metropolitan area.


A little more locally, the Potomac River and the Occoquan Reservoir are the main supply of water for Fairfax Water which also supplies Prince William Service Authority and American Water

Water supply in Prince William County is a mix of water from the Occoquan Reservoir, the Potomac River, groundwater and Lake Manassas.

And yet our water supplies are connected to each other and the land


The Occoquan Reservoir was built 1960’s expanded to its current capacity in the 1980’s.

The Occoquan watershed is often described as the most urbanized watershed in the nation.

Think about that for a minute, certainly there are far more urbanized areas in the United States, but they do not have functioning watersheds. During their growth and development cities across the nation confined and subsumed many thousands of streams, erasing them from public memory leaving only stormwater.


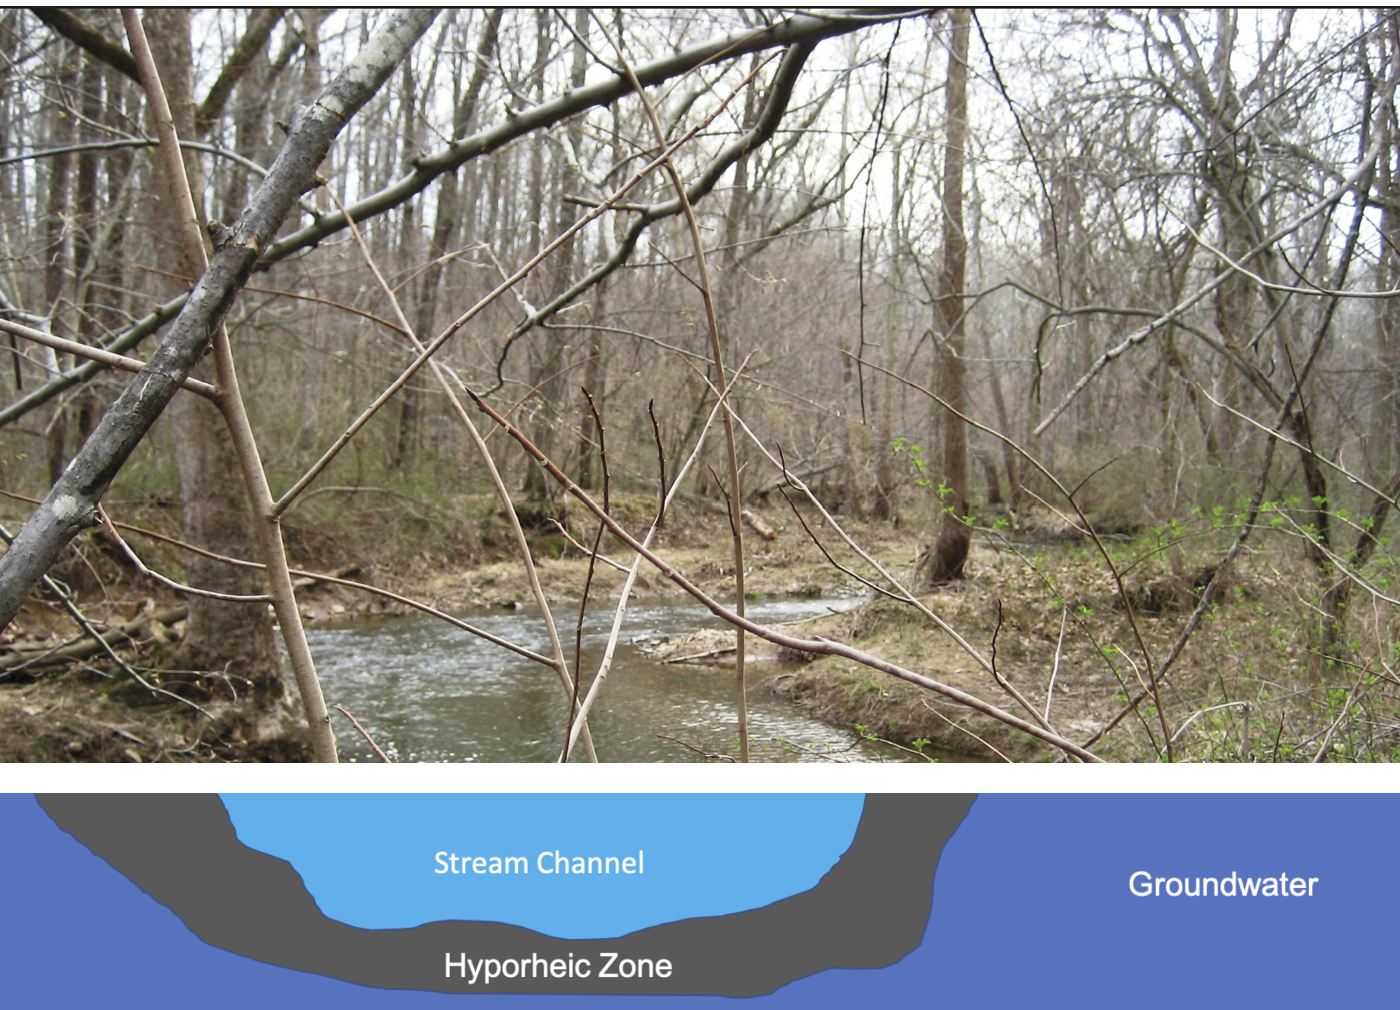
Water comes into the Occoquan water basin from rainfall (and melting snow) . The streams and creeks of the watershed come together at Bull Run and the Occoquan River to deliver the water to the Reservoir. Groundwater is part of this system maintaining the base flow of the rivers.

There is no longer enough water in the rivers to meet the demand, the Upper Occoquan Service Authority, UOSA, -the waste water treatment plant also delivers 40 million/day of recycled water that originated in the Potomac River to the Occoquan Reservoir. Supplementing the supply.


Our Climate is changing. Locally, average rainfall has been increasing. Over the last 30 years it increased slightly to approximately 44 inches per year. Climate forecasts for our region by the ICPRB project us to get wetter with more intense rainstorms - and droughts to become more severe.

Increased rainfall may not bring us more water. Land use changes also impact our water resources. Increasing impervious cover from roads, pavement and buildings does two things:
  1.  It reduces the open area for rain and snow to seep into the ground and percolate into the groundwater and.
  2.  The impervious surfaces cause stormwater velocity to increase and the amount of stormwater runoff to increase more the 5 times. The result is Flooding and diminishing groundwater.

Changing land use and increased rainstorm intensity results in flooding. Stormwater runoff increases in quantity and velocity washing away stream banks, flooding roads and buildings carrying fertilizers, oil and grease, and road salt to the Occoquan Reservoir.


Here in the only USGS groundwater well in the rural area you can see both the seasonality of water, but also the slowly falling groundwater level since 2004. Despite extremely high rainfall in the last few years.

Increases in groundwater use and reduction in aquifer recharge can result in the slowly falling water levels that appear to be showing that our groundwater is being used up. This will impact stream flow.


The changing land use impacts the regional hydrology and groundwater recharge so the quantity of available groundwater and streamflow decreases over time.

The Rural Crescent created in 1998 was eliminated in 2022 by the BOCS adoption of the new comprehensive plan.

Despite available tools, Prince William County did not study the impact of the proposed changes to the quality, availability and sustainability water supply as they are required to do under the Comprehensive Plan law. Nor did Prince William County study the impact of the proposed changes to compliance with the WIP III mandated under the Chesapeake Bay TMDL.

Fairfax Water took the unusual step to ask that Prince William County convene the Occoquan Basin Policy Board and oversee a Comprehensive Study of the impacts on water quality and quantity of the planned land use changes in PW Digital Gateway CPA and the 2040 Comprehensive Plan Update before any action is taken. They declined. 

Sunday, March 26, 2023

Urbanization’s Impact on Stream Water Quantity and Quality


Impacts of urbanization on stream water quantity and quality in the United States | Publications | SRS (usda.gov)

Researchers at the U.S. Department of Agriculture Southern Research Station have for some time been studying the impact of urbanization on our water resources. As we are moving ahead with the industrialization, and residential development of the Occoquan Watershed. I though it might be useful to summarize the work of two of the researchers, Ge Sun and Peter Caldwell. The below is excerpted from their article:

Sun, Ge; Caldwell, Peter 2015. Impacts of urbanization on stream water quantity and quality in the United States. Water Resources Impact, Volume 17 Number 1. 4 p.

In the United States 80% of the population lives in urban areas. The most obvious and direct impact of urbanization on watersheds is altering the hydrologic cycle that controls the flow of water in ecosystems. Manmade structures such as irrigation canals, wells, reservoirs, dams, and paved roads have shaped the natural watershed landscape.  Though there are still gaps in our understanding of the interactions among processes associated with urbanization (land conversion, increasing impervious areas, new pollutants), hydrological functions (water budget change and infiltration), and ecological functions (biota change) and the time scale of impact, we’ve learned much in recent decades. It is clear that rising populations and increased development pose major threats to our future water supply.

Converting forest lands and natural landscapes to urban uses increases the surface reflection of solar radiation, enhances storm intensity, and causes heat island effects (O’Driscoll et al., 2010). Removing forest and natural vegetation cover reduces plant transpiration, and reduces water’s ability to infiltrate into soil and the soil’s ability to accept the water. These factors result in a dramatic increase in stormwater overland flow.

To maintain water supply from an urbanized watershed requires some combination of factors such as infrastructure renovation, improved design and scale of new water and sanitation treatment systems, and expanded implementation of watershed services management will be needed. Urbanization dramatically increases population and the demand for water; and affects ecosystem processes, and as a result, water quantity and quality in streams. Alterations of watershed hydrologic cycles are the root causes of the stream ecosystem degradation observed in urban landscapes.

The Impacts of urbanization on water quality are primarily caused by two key factors – significant production of pollutants and reduction of retention capacity of the watersheds as a result of increased impervious surfaces (Sun and Lockaby, 2012). Conversion of portions of watersheds from forest to urban cover often elevates sediment and nutrient concentrations by tens to hundreds of times.

The threshold of impervious surfaces at which water quality and flow changes occur is 5%-20%. In addition to sediment and nutrients, other concerns to human health are that urban waters often contain pharmaceuticals such as antibiotics, analgesics, narcotics, and psychotherapeutics, pesticides, heavy metals, pathogenic microbial populations, and organic pollutants.

Protecting water resources across urbanizing landscapes requires management of land cover at the watershed scale by adopting urban best management practices (BMPs) and protecting source headwaters. The contemporary watershed management goal is to prevent development beyond the critical point which varies based temperature, rainfall, and geology; or otherwise, minimize impact in critical locations that are particularly sensitive to water quality and quantity. Although difficult to quantify, the opportunity cost of maintaining forest land cover in a watershed is likely less costly than allowing urbanization to occur, increasing storage and applying conventional approaches to water treatment to mitigate the water quality impairment.

In order for us to have a sustainable, adequate and quality water supply, we need to ensure that the source water of the Occoquan Reservoir is protected. Prince William County needs to convene the Occoquan Basin Policy Board and oversee a Comprehensive Study of the impacts on water quality and quantity of the planned land use changes in the county before do irreparable harm to our source water supply.

Wednesday, March 22, 2023

Distributed Solar


Solar parking structure at METRO station

In 2018 Virginia was identified as one of the states that is not utilizing their technical potential for rooftop solar. Since that time Virginia passed the VCEA, the Virginia Clean Economy Act. State incentives a well as the mandates could help build solar. However, utility scale solar farms may not be the only or best answer. Distributed solar as part of a series of microgrids along with solar farms built on brownfields or closed landfills can be used to achieve the goals of the VCEA without building on more fragile ecosystems in our essential watersheds.

Proposed site for a solar farm in Bull Run Watershed

For instance the Washington, D.C., Metro transit system has recently contracted to build solar canopies at four of its rail station parking lots, with a projected capacity of 10 megawatts. This has been in the works for several years.  After extensive planning Metro negotiated a 25-year contract with TotalEnergies to install and MN8 Energy LLC. to own and operate solar carports at four Metro sites. 

When the solar carports are completed and operational, the 11 acres of solar panels (equivalent to 8 football fields) will collectively generate around 10 megawatts of electrical capacity. This is a first step, but still, this project one of the largest community solar projects in the Mid-Atlantic region and in the nation. Community solar may be the way of the future.

Commuter parking lots, the parking lots and rooftops of the rapidly spreading commercial and industrial development in Prince William and Loudoun Counties are potentially all locations for solar. Commuter and community parking with solar and EV charging stations could also address some of the challenges with the replacement of internal combustion automobiles with electric vehicles.  

Construction cost are higher for solar-powered parking structures with EV charging than for a rural solar “farm.” The physical structures need to be taller and more robust than a conventional solar farm, requiring more materials like metal and concrete; however, utilizing existing parking lots with existing stormwater management infrastructure reduces those costs. EV chargers also cost money, but addresses the need for accessible EV charging infrastructure for diverse populations and communities.   

Southern Avenue under construction


Sunday, March 19, 2023

Solar Farm Proposed for Logmill Road


aerial view of the property from Historic Prince William

Inside NOVA and several other local sources have reported that a 20 megawatt solar farm is proposed for the Gainesville district of Prince William County. I am a little more specific with location so that neighbors can take a closer look.

The project identified in the planning que as Waterloo Solar, #SUP2023-00008 Gainesville District is a Special Use Permit (SUP) request.  The property is located at 2539 Logmill Road, Haymarket, on the north side of Logmill Road approximately ±772 feet west of James Madison Highway (Route 15). This property is currently owned by William and Elizabeth Latham. It was previously owned by the estate of William Latham Sr.

The SUP is to use 125 acres out of a total ±232.26 acres for a solar farm. They need a SUP because the property is designated as Agriculture and Forestry, AF, and Environmental Resource Protection Overlay, ERPO, in the new Comprehensive Long-Range Land Use Plan Map. A portion of the site lies in the 100-year Flood Hazard Overlay District and the Chesapeake Bay Act Resource Protected Area. The surrounding areas to the north, east and west are also designated as Agriculture and Forestry, AF, in the Long-Range Future Land Use Map and are occupied by single family residential homes and farmland. Under the old comprehensive plan they were all A1 zoning.


the subject property with Parnell Court to the left

The proposed project is for the life of the solar panels, 35 years. According to the Planning department the proposed use will reduce available land for crop agriculture and could impact runoff and erosion of the land with the added access roads and land disturbance. However, the proposed site layout seen below preserves environmentally constrained areas as well as specimen trees and does not propose clearing forested areas. In addition, the applicant has proposed a possible other agricultural form of use of the land - livestock grazing in certain areas to get around the zoning issue. Mr. Latham is a farmer and grazes cows in other locations in Haymarket. (One of which is more or less behind my house.)

from the SUP submission

According to the Planning department “For this use to be lawfully permitted on the subject parcel, one of the following two actions must take place: 1. Proof of continuation of farming through a valid bona fide agricultural use determination; or 2. Subdivide residentially used property from residual land proposed for solar energy facility use.”

Planning has suggested several mitigations to address concerns; however, recently Prince William County has a history of either waving, modifying or removing mitigations at the last minute (literally at some recent all night public hearings at dawn) so I have a certain uneasy feeling about this.

The planning department suggests that all on-site utility lines shall be placed underground to the extent feasible and as permitted by the serving utility, except for the main service connection at the utility company right-of-way and any new interconnection equipment, including without limitation any poles, with new easements and right-of-way. The facility would sit on 125 acres of the property and produce 20 megawatts of electricity. It will be interconnected with the Northern Virginia Electric Cooperative grid. The type of interconnection necessary for a power generation facility is not discussed. Nor is there any discussion of what that will look like. This matters, especially to the lovely homes surrounding the property and the visual byway that Rout 15 is supposed to be.

The project would include a 100-foot setback from all property lines and the height of solar panels would be capped at 9 feet. However, the site restrictions read: “No aspect of the facility shall exceed 25 feet in height, as measured from grade at the base of the structure to its highest point. Solar panels shall not exceed 13 feet in height above grade, from the highest grade around the structure.” The planning department asks the site developer, HCE Waterloo Solar LLC, to provide a visual assessment of the visual impacts of the proposed solar energy system from public roadways and adjacent properties.

Planning stipulated that "Except for motion activated safety and security lighting, which shall be downward facing, the Facility shall not be lit. Lighting shall not exceed fifteen (15) feet in height. Compliance shall be demonstrated on the final site plan."

In addition, Environmental Services asks the developer to “Guarantee to develop, implement, and maintain native vegetation to the extent practicable pursuant to a vegetation management plan by providing native perennial vegetation and foraging habitat beneficial to game birds, songbirds, and pollinators. Plant buffers with vegetation that benefit pollinators and early successional species around the boundary of the solar energy system.”

Environmental Services points out that “there are extensive RPAs throughout the parcel, but the existing conditions lack any effective vegetation. Please commit to reforesting the RPAs throughout the project area. The Riparian Buffer Guidance Manual has planting standards that should be used and referenced in a SUP Condition committing to this restoration. Staff also recommends the Applicant commit to a minimum 2-year invasive plant control period to help ensure new plantings are not overcome by non-native invasive vegetation.” This could be an important mitigation in this particularly sensitive portion of the Occoquan Watershed. It is important to make sure it actually happens. 

Generally, the developer appears to be laying out the solar arrays to avoid sensitive environmental features, but this effort needs to be clearly demonstrated on the SUP Plan. Not empty promises that will be waived or removed at the last minute. In addition, a stormwater management plan is very necessary for the site. Solar panels increase stormwater velocity and this needs to be addressed.

Wednesday, March 15, 2023

EPA proposes drinking water standards for PFAS

On Tuesday the U.S. Environmental Protection Agency (EPA) announced its long awaited proposal for the national drinking water standard for six per- and polyfluoroalkyl substances (PFAS) . 

  • PFOA and PFOS: EPA is proposing to regulate PFOA and PFOS at a level they can be reliably measured at 4 parts per trillion.
  • PFNA, PFHxS, PFBS, and GenX Chemicals: EPA is also proposing a regulation to limit any mixture containing one or more of PFNA, PFHxS, PFBS, and/or GenX Chemicals. For these PFAS, water systems would use a hazard index calculation, defined in the proposed rule, to determine if the combined levels of these PFAS pose a potential risk.

If finalized, the proposed regulation will require public water systems to monitor for these chemicals. It will also require systems to notify the public and reduce PFAS contamination if levels exceed the proposed regulatory standards. At the announcement EPA Administrator Michael S. Regan said “EPA’s proposal to establish a national standard for PFAS in drinking water is informed by the best available science, and would help provide states with the guidance they need to make decisions that best protect their communities. This action has the potential to prevent tens of thousands of PFAS-related illnesses and marks a major step toward safeguarding all our communities from these dangerous contaminants.”

There are thousands of PFAS chemicals, and they are found in many different consumer, commercial, and industrial products. This category of chemical has been widely used for over 80 years mainly for their ability to repel oil, grease, water, and heat. We are all exposed to PFAS in everyday life. Stain-resistant carpeting, nonstick cookware, grease- and water-proof food packaging, fabric softeners, waterproof clothing, cosmetics, and through our diet and water. These forever chemicals have remained in the soil, been taken up into plants, and made their way into animals who eat those plants. According to Fairfax Water diet is responsible for 66%-72% of exposures to PFOA and PFOS (the two chemicals that have been most widely studied). In some cases, they have also leached into both surface and groundwater. Water is responsible for 22%-25% of exposures.

In anticipation of future regulations, Fairfax Water hired an independent lab to test their water using current EPA-approved methods that can detect PFAS at much lower concentrations than previous methods. Fairfax Water also participated in the Virginia Department of Health (VDH) Occurrence Study that was completed in 2021. However, the practical quantitative limit was 4 ppt just at the proposed regulatory limit.

Some of Fairfax Water’s results for PFOS and PFAS were above the MRL and the regulatory limit. The ones below cannot be quantified. PFAS dissolves in water, and combined with their chemical properties means that traditional drinking water treatment technologies used at water treatment plants are not designed to remove them, it is believed though, that carbon filtration does remove some. Activated carbon adsorption, ion exchange resins, and high-pressure membranes have been found to remove PFAS from drinking water, especially Perfluorooctanoic acid (PFOA) and Perfluorooctanesulfonic acid (PFOS), which have been the most studied of these chemicals.

Keeping PFAS out of the source water the real challenge when PFAS is in our diet and wastewater is reused in our drinking water supplies. To stay within the regulatory limit, Fairfax Water will have to identify the PFAS content in the various source of water and can mix them to minimize exposure or remove them. Source water protection will also have to be part of the solution. With that in mind both Fairfax Water and the EPA have developed an analytic framework which provides information about PFAS across the environment. This information will help them better understand potential PFAS sources in our communities and develop a road map to complying with the regulation if it is finalized and providing safe drinking water to Northern Virginia.

“At Fairfax Water, we know that drinking water is vital to public health,” stated Fairfax Water General Manager Jamie Hedges.  “We’ve taken a proactive approach to address PFAS through voluntary PFAS monitoring and educating the community on the importance of protecting the region’s source water from these compounds.  Stopping PFAS at the source, before it reaches drinking water sources, is key to ensuring our customers have high-quality water at affordable rates.”


Sunday, March 12, 2023

DEQ Amends its Data Center Diesel Generator Variance

After the Public hearing on February 27, 2023 in Woodbridge, the Virginia Department of Environmental Quality (DEQ) has decided to revise the proposed variance for data centers originally published on January 26, 2023, to restrict its application to emergency generators located at data centers in Loudoun County only, removing Prince William and Fairfax Counties from the proposed variance.

Data center operation relies on the use of large amounts of electricity from the grid. Due to the fast pace of growth in data centers in Northern Virginia Dominion Energy has not kept up with the surging demand for power. According to Dominion Energy, the transmission constraints will persist until at least 2025 and probably 2027. According to PJM the currently operating data centers could cause a cascade failure in the power grid during periods of high demand.

Maintaining an adequate level of generation resources, with the right operational and physical characteristics, is essential for PJM’s ability to serve electrical demand through the energy transition mandated by the Virginia Clean Economy Act of 2020. PJM anticipates that retirements of fossil fuel electricity generation are outpacing the construction of new electrical generation resources; and expects that the growth rate of electricity demand will continue to increase from electrification coupled with the proliferation of additional high-demand data centers in the region. The sheer size of the load needed for data centers and its flat profile throughout the day, require more name plate generation by variable sources in addition to  transmission capacity. So in their most recent report PJM indicated the electrical supply constriction may exist far beyond the period of the current variance, Spring 2023 and need to be renewed.

In the revised variance DEQ voices concern that Loudoun County is an area in which there may not be a sufficient amount of electricity available for data centers due to these severe, localized constraints in electricity transmission and demand. To prevent knocking out the entire region, in times of grid stress, they need for the data centers to power down. However, to keep operating, the data centers would need to step off the grid and use their generators. The data centers will be paid a bonus to step off the grid.

This proposed order and local variance would provide data centers located in Loudoun County a measure of relief from existing regulations and permit provisions that limit the use of Tier II and Tier IV emergency generators. Under the variance, data centers in Loudoun Count may operate their Tier II and Tier IV generators during periods that PJM has initiated a "Maximum Generation Emergency/Load Management Alert" or during periods that PJM has declared a "Post Contingency Local Load Relief Warning" for Loudoun County. According to the Washington Post: “Since 2020, three “Maximum Generation Emergency Load Alerts” have been issued — all of them last year, according to the PJM website.” The second category, “Post Contingency Local Load Relief Warnings” — are issued far more common, with 90 occurring in Dominion’s coverage area last year.  

DEQ estimates that there are approximately 4,021 diesel-fueled Tier II generators (older and of higher emissions) and 130 Tier IV (lower emissions) generators located at data centers in Loudoun County. The likely potential pollutants from a generator could include nitrogen oxides (NOX), particulate matter (PM10 and PM2.5), carbon monoxide (CO), volatile organic compounds (VOCs), and sulfur dioxide (SO2). The exact number and duration of events, if any, that may occur before the end of July 2023 when this variance ends cannot be predicted. However, by federal regulations limit the amount of nitrogen oxide emitted by permit holders to 100 tons per year and DEQ estimate the emission per hour per generator. With those restraints all the generators could run approximately 5.13 days this is the potential emissions in Ashburn for this variance.


The comment period has been extended through April 21, 2023. A new public hearing will be conducted in the Conference Room, Northern Regional Office, 13901 Crown Court, Woodbridge VA, at 11:00 a.m., on Thursday, April 6, 2023 the second day of Passover.


Wednesday, March 8, 2023

Even with the Rains the Colorado River is still in Trouble

Over one hundred years ago the Colorado Compact apportioned the water of the Colorado River amongst the seven compact states (Colorado, Utah, Wyoming, New Mexico, Arizona, California, Nevada) and Mexico. 1922 Colorado River Compact allotted the Colorado’s water on the basis of territory rather than prior appropriation. Before this agreement was negotiated ownership of water rights was based on historic use, first to use the water owned it in perpetuity.  California was growing so fast the other territories feared they would appropriate all the water preventing their territories from ever being able to grow. The allocation of water rights based on territory allowed development to proceed in the lower basin (essentially California at that time) while safeguarding supplies for the upper basin. Then, as now, California's growth and demand for water was viewed with concern by her neighbors. To this day California still has the most senior water rights; however, the historic allocation of water rights is being questioned due to the growing water crisis.

Lake Meade 2000-2022 from NASA

The amount of water allocated under the Colorado Compact was based on the belief that the river's average flow was 16.5 million acre feet per year. The upper Colorado River was allocated 7.5-million-acre feet to the upper basin (Colorado, Utah, Wyoming, New Mexico), the lower basin Colorado River (Arizona, California and Nevada) were allotted 7.5-million-acre feet and Mexico was allotted 1.5-million-acre feet.

From the start there was a problem; they over allocated the Colorado River.  According to the University of Arizona, a better estimate would have been 13.2-million-acre feet at the time of the Colorado Compact.  Once the flow of the Colorado exceeded needs, but this is no longer true. Use of the river has increased tremendously over the last century. While over the same period of time, the flow from the Colorado River has fallen attributed to changing land use and changing climate. From 2000 through 2022, the river's annual flow averaged just over 12 million acre-feet; and in each of the past three years, the total flow was less than 10-million-acre feet.

The records going back to Paleolithic times (more than 10,000 years ago) indicates the region is subject to periods of mega-droughts in the distant past and climate forecasts for the future are dire. There has been a drought somewhere in the Colorado River Basin for the past 22 years. This combined with higher temperatures has led to what some are calling aridification of the region. The Colorado River and its watershed are in trouble, the states need to work together to come up with a sustainable use plan for the future.  

Population growth, increased food production and increased power production all consume more and more water. The water available from the Colorado River has decreased, not increased with the increased demand. Even without climate change more than 35 million people (in the upper and lower basins) now depend upon the Colorado River’s waters for their water supply. The need for water is always growing with population and wealth. Currently in the upper basin, 44% of Wyoming, 37% of Colorado, 89% of Utah, and 45% of New Mexico are in drought. In the lower basin 13% of Arizona, 83% of Nevada and 49% of California are in drought. This is actually is much improved over the summer. 

from the Lake Meade water database

California is the most populous state in the nation and Nevada is one of the fastest-growing states in the nation and their need for water has continued to grow. Despite aggressive conservation activities the region simply does not have enough water to meet the projected demand. Las Vegas was able to reduce water use by a third by the implementation of draconian conservation measures (removal of ornamental turf grass and utilization of low flow plumbing fixtures etc.). This was city and suburban consumption, not agricultural or power generation use of water which is much more difficult to cut and utilizes the largest share of water. Remember though, that agriculture use of water is to feed the growing number of people. Hydropower, is a significant source of power to the region.

Lake Meade sits on the Nevada-Arizona border and was created in 1935 by the construction of Hoover Dam. Lake Mead and the upstream Lake Powell are the major water storage facilities in the Colorado Compact system. Roughly 96% of Lake Mead's water comes from melted snow in the upper Colorado River basin states.  The Compact states have not delt with the fact that the allotted water in the basin exceeds the average long-term (1906 through 2018) historical natural flow by a considerable amount. To date, the imbalance has been managed by slowly using up the considerable amount of reservoir storage capacity in the Colorado River system- Lake Powell and Lake Mead once held approximately 60 million acre-feet.

When built, it was assumed that drought years would be followed by wet year to refill the reservoirs. That has not happened recently, the last time the reservoirs filled was 1983. Instead, the reservoirs have been used to hide the fact that use of water exceeds average river flow and delay finding a long term sustainable solution. This cannot continue. The reservoirs (Lake Meade and Lake Powell) have dwindled to their lowest levels recorded and are nearing dead pool state when water can no longer be drawn out. Dead pool levels mean the dam can no longer release water downstream or generate power. 

The true existential crisis for the areas that depend on the water from the Colorado River looms just over the horizon. For without water there is no life. The states of the Colorado Compact need more water. Overuse is killing the Colorado water basin which suffers from decimated aquatic ecosystems, overdrawn and irreparably damaged groundwater aquifers, and polluted agricultural and urban runoff.

Water releases down river from Lake Meade and Lake Powell reservoirs are determined by the Bureau of Reclamation. Each year they forecast reservoir water elevations. Plans that were developed over the past two decades lay out detailed operational rules for these Colorado River reservoirs. The Bureau of Reclamation asked the states to voluntarily cut usage by 2 to 4 million acre-feet in response to the ongoing drought and historically low water levels in Lake Mead and Lake Powell reservoirs. 

However, the cuts in water usage proposed by the states are nowhere near enough to stop the falling water levels in the reservoirs. California’s water rights are considered senior and California interprets the law to mean Arizona should cut its supply before California. The Upper Basin states have said the Lower Basin states should receive the most cuts. All are afraid that emergency cuts will become permanent.

Last July drought operations were implemented to protect Lake Powell and the Bureau of Reclamation Since the states could not do it the Bureau of Reclamation is set to release a proposal on how to operate the Lake Powell and Lake Mead reservoirs and their adjacent dams (Glen Canyon and Hoover) in March, with the goal of finalizing it by mid-August.  Right now, they are in a stalemate until the water is rationed to overcome the political hurdles to renegotiate the Colorado Compact. California won’t give up its senior water rights and Colorado is attempting to dam tributaries to the Colorado River to hold all water they can in Colorado. It will have to reach complete crisis level before the states are ready to renegotiate the Colorado Compact and the winter rains and snow have rescued the situation for now.   

Monday, March 6, 2023

The First River Cleanup of the Season


from MF Master Naturalists

A sure sign that Spring is in the air is the arrival of river cleanup season. On March 11th 2023  The Bull Run Watershed Protectors will hold the first river cleanup of the season in Manassas cleaning the stream valley behind Costco, across Lomond to Ashton Rd. and the shops/restaurants adjacent down to Walgreens at Sudley Manor Road.

The community, Honor Societies, Scout troops and ROTC’s have helped to remove over 12,000 lbs. of trash since 2018 from the stream valley.  The result has been the return of frogs, toads and salamanders.  Which are indicator species for clean water.  

Unfortunately, it is necessary to hold these river cleanups annually. Year after year volunteers clean our roadways, streams, rivers, and streambeds of trash that started as litter and carried along by stormwater and wind into our waterways and parks. We also remove items that were illegally dumped or carried by off by storms. Don’t litter and teach your children not to litter, that is the best way to prevent trash along our roads, streams and waterways. Bring the kids out to help cleanup the trash dropped or thrown on the ground. It does not magically disappear, but finds its way carried by stormwater to our waterways and parklands disrupting the natural water flow and beauty of our natural world. Come out and help us make our water ways free of trash.

The Bull Run Watershed Protectors are the Merrimac Farm Master Naturalists, Friends of the Square, Prince William Soil and Water Conservation District, Keep Prince William Beautiful, Prince William County Watershed Division and Environmental Services. They will provide safety vests, gloves, grabbers and bags. Pleas join in this worthwhile endeavor! Online sign up is at this link.

Rain date: Saturday, March 18th, same time and place

https://www.mapquest.com/us/virginia/walgreens-262893878


Wednesday, March 1, 2023

Watersheds and Land Use

The Occoquan watershed is often described as the most urbanized watershed in the nation. Think about that for a minute, certainly there are far more urbanized areas in the United States, but they do not have functioning watersheds. During their growth and development cities across the nation from New York, to Philadelphia through Baltimore and Washington, Chicago, San Francisco, Los Angeles and  hundreds more across the nation confined and subsumed many thousands of streams, erasing them from public memory.

In a study done early this century they found that Philadelphia had buried 73% of its streams. Another study counted 66% buried in Baltimore. Many streams that remained on the surface were sick or dying. A stream is a living ecosystem. It includes not just the water coursing between the banks but the earth, life and water around and under it. Beneath a living streambed is a layer of wet sediment, small stones and tiny living creatures called the hyporheic zone. Stream water filters down into this dynamic layer between surface water and groundwater, mixing with the groundwater pushing up to feed the rivers during dry spells. Water in the hyporheic zone flows downstream like the surface water above it but much, much more slowly.

For a large river the hyporheic zone is the essential engine of life. This zone can be tens of feet deep and can extend up to a mile laterally beyond the banks. It keeps the waterway healthy by regulating critical physical, biological and chemical processes, including riverbed aeration, water oxygenation, temperature moderation, pollution cleanup and food creation. Developing this lateral zone slowly begins the destruction of the watershed.

Cutting down streamside vegetation and woodland buffers that once slowed and absorbed rains causes floods. These floods were only made worse by covering the ground with compacted and/or impervious surfaces.  The faster flow of storm water gouged the riverbed. Later, urban planners and engineers funneled streams into buried pipes so they could build more city on top, disconnecting waterways from soil, plants and animals. The cumulative impact of these injuries led to flash floods, unstable banks, heavy pollution and waning life. 

In general, streams in urbanized areas are likely to have higher levels of oxygen demand, nutrients, suspended solids, ammonium, hydrocarbons, and metals. The negative impacts of urban land use on adjacent reservoirs, streams, and rivers have been well-documented in the literature. To establish effective water quality management policies, it is essential to understand the true nature of the relationship between water quality and urban land use.

Scientists have found that land use management can enhance or destroy stream water quality.  Particularly they found in a recent study when urban land use is in the range of 1.1%–31.5% of a watershed a watershed can still be restored. If urban land use exceeds 31.5% in a watershed water quality does not respond to restoration measures as expected. Once you destroy a watershed we do not know how to restore it.

Although close relationships between the water quality of streams and the types of land use within their watersheds have been well-documented, many aspects of these relationships remain unclear. Recent studies have suggested that the relationship is not linear which is commonly used in current land use models. Many of our remaining watersheds today are degraded characterized by degraded forests, invasive plants, soil erosion, erratic streamflow, declining groundwater resource, loss of biodiversity, microclimate deterioration, and declining ability to store water.

Prince William county is promoting regressive land use policies and practices, those from the last century when we did not recognize that all water is connected and the health of the watershed determines the quantity and quality of water resources. The hyporheic zone is an integral part of our freshwater ecosystems.  The hyporheic zone is made up of sediments, but is porous enough to allow the exchange of nutrients, dissolved oxygen, and water and serves to keep our streams healthy.  Water doesn’t just flow through the hyporheic zone, but has a specific residence time. This allows pollutants and nutrients to be removed, protecting water quality. During drought, flooding, and temperature extremes, the hyporheic zone becomes a refuge for many species. Let us hope that Prince William County can correct course before the Occoquan watershed is degraded beyond redemption.