Monday, June 29, 2015

San Francisco Cut-Off with Senior Water Rights Holders


The drought in California continues. It is the dry season and there will be no rain until late fall or early winter. In an average year precipitation in California is about 23 inches. However, since 1960 almost 40% of years have been drought years. The evidence tree rings show that California has had alternating cycles of severe drought and heavy precipitation a dangerous pattern when water use is at its limit. Right now California is experiencing the most severe drought in the past century. This may be the result of a changing climate, the beginning of a long period of drought or just extreme weather. No one really knows how long this drought will last, but tree-ring studies indicate one 61 year drought from 1760-1820. Anything could happen-the next rainy year might be next year or in a half century.

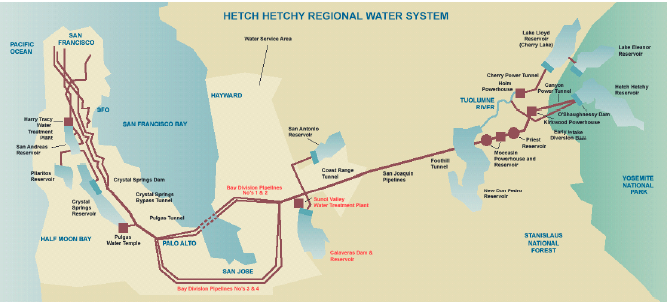
Meanwhile, water reserves continue to dwindle down and so the California State Water Resources Control Board has issued “curtailment orders” to more than 100 senior water rights holders on the Merced and upper San Joaquin, Sacramento, Tuolumne and Scott rivers as well as the Antelope Creek. These curtailments have not just been to agricultural water districts and farmers, but also communities. San Francisco had their rights to divert water from the Tuolumne River to the Hetch Hetchy reservoir curtailed. San Francisco depends on water diversion from the Tuolumne River to fill its reservoirs and supply the city with water.


There is some question as to the date of the San Francisco’s claim on the Tuolumne River, it has been variously reported to be 1902 and 1903. Also, there is some question whether the most senior claims, and riparian claims, can be curtailed. The most senior of all water rights is the riparian right. The riparian right is a right to the natural flow of a watercourse- if the river runs through your land, you can use the water, but not store it. Riparian rights are senior to pre-1914 appropriative water rights, and are not lost by non-use. California created the State Water Resource Control Board to oversee the water rights in 1913 and began issuing permits for water claims in 1914. Prior to 1914, there was no comprehensive permit system to establish water rights in California. To establish an “appropriative right” right required simply posting and recording a notice of intended water diversion and use, and the construction of the system to divert and use the water. Claims going back to Gold Rush days are lumped together as pre-1914 rights.

Today the California Department of Water Resources (DWR) “owns” the California state-owned State Water Project (SWP) just as the U.S. Bureau of Reclamation “owns” the federally-owned Central Valley Project (CVP) water. Together they form the largest water storage and transportation system in the world with 1,200 miles of canals and nearly 50 reservoirs. Water is doled out based on the system of rights. There is hardly any water flowing naturally in California. Several lawsuits have already been filed by senior water rights holders who are challenging the California State Water Resources Control Board’s authority to cut their rights.

Water is wealth. Newer or junior water rights are the first to be cut back or curtailed when water supplies are inadequate. In this way, senior water rights holders can continue to get water deliveries in time of drought. In April of this year, the fourth year of the current drought, almost 9,000 junior water rights holders were ordered to stop using water this year. Now the California State Water Resources Control Board issued “curtailment orders” to Pre-1914 Claims of Right that Commenced During or After 1903.

While this is calamitous to the farmers who stand to lose $60-$100 million in crops already in the ground, San Francisco is not likely to run out of water any time soon. The city made sure that the Hetch Hetchy reservoir was over 90% full before the order was issued. The bigger issue for San Francisco is their rights to the water. The Hetch Hetchy Project supplies water to the City of San Francisco and surrounding Bay Area communities, and regulates stream flow in the Upper Tuolumne River, Cherry Creek, and Eleanor Creek. The Hetch Hechy system consist of the Hetch Hechy Reservoir, Cherry Reservoir and Eleanor Reservoir a portion of the New Don Pedro Reservoir as well as other small surface reservoirs of various size and significance and five groundwater basins. The stored water in the system is transported from the Tuolumne River to the cities, towns and farms supplied by the system via the Hetch Hetchy Aqueduct, the California Aqueduct, the Delta Mendota Canal, the South Bay Aqueduct, and the Pacheco Tunnel. The curtailment order challenges the City’s right to manage and regulate the Tuolumne River flow and sets precedence for the remaining city water rights.

It appears as if the courts will regulate water and determine water rights, too.

Thursday, June 25, 2015

Tighter Regulations for USTs

On Monday, the U.S. Environmental Protection (EPA) announced that they are strengthening the federal underground storage tank (UST) requirements. This is important because leaking underground storage tanks is the major source of groundwater contamination nationwide. Currently, there are approximately 569,000 active USTs in the U.S. that are regulated under UST regulations. The announced changes will expand the number of regulated tanks by eliminating some exemptions and deferrals. Improved equipment and leak detection will further prevent and detect releases from USTs protecting our precious groundwater supplies.

States and territories primarily implement the UST program- 38 states, plus the District of Columbia and Puerto Rico, have approved state programs the other 12 states implement the federal program. Many states already have some of these new requirements in place, but not all. Virginia began a program to register, regulate and cleanup USTs and their contamination in 1989 in compliance with the 1988 EPA regulations. The Virginia program has spent more than $67 million to cleanup contamination from USTs and had protective requirements to reduce the future contamination, but does not require secondary containment on all tanks and piping systems.

The EPA’s action will strengthen existing UST standards nationwide and help ensure a consistent level of higher standards on all USTs in the U.S. The new regulations will tighten the EPA’s original 1988 UST regulations by requiring secondary containment on tanks and piping systems, and focusing on properly operating and maintaining existing UST systems.

The revised requirements include:
  • requiring secondary containment requirements for new and replaced tanks and piping;
  • adding operator training requirements;
  • adding periodic operation and maintenance requirements for UST systems;
  • eliminating deferrals for emergency generator tanks, airport hydrant systems, and field-constructed tanks;
  • requiring new release prevention technologies and leak detection alarms.
You probably don’t remember, but leaking underground storage tanks were a huge problem in the 1980’s. By the 1980’s there were over 2 million fuel and chemical storage tanks that were buried underground. Many of those tanks had been in the ground for decades as gas stations covered the country. After World War II it became common practice to bury fuel tanks in the ground. No one thought about what would happen over time when these tanks rusted and began to leak creating a slow and steady source of contamination. By the 1980’s many of these tanks were leaking and contaminating soil and groundwater. To address the threat to groundwater from leaking underground storage tanks, Congress added Subtitle I to the Solid Waste Disposal Act (SWDA) and in 1986 created the Leaking Underground Storage Tank (LUST) Trust Fund that is financed by a 0.1 cent federal tax on each gallon of gas sold.

The trust fund was created to:
  • Enforce cleanups by recalcitrant parties
  • Pay for cleanups at sites where the owner or operator is unknown, unwilling, or unable to respond, or which require emergency action because drinking water supplies are threatened. 
The tax has generated far more money than has been used in the program. Since 2012 $3.4 billion of the LUST Trust Fund was transferred to the Department of Transportation’s Highway Trust Fund. In addition to the federal cleanup funds, 38 states have UST cleanup funds (funded by the tax) which pay for most UST cleanups and are separate from the federal LUST Trust Fund; collectively states raised and spent more than $1 billion annually on LUST cleanups.

Over the years the states have done a good job of addressing the historic backlog of UST problems. With the help of the various Trust Funds more than 1.8 million USTs have been properly closed, 525,095 fuel releases have been discovered of those 452,847 have been cleaned up and completed. However, it is time to tighten the UST regulations and try and cleanup the 72,248 cleanups have not yet been finished.

Over time all tanks and piping systems will grow old and fail. It is necessary to have a secondary containment system to capture the fuel when it leaks out of the tank or pipe, in addition to an alarm system to notify operators of the leak before the secondary system fails. Inspections and maintenance are necessary to ensure that systems are working properly and in good condition and workers are not just silencing alarms and ignoring problems.

Now that EPA has tightened the UST regulations, they need to think about regulations for above ground tanks (ASTs). The U.S. Environmental Protection Agency does not regulate most aboveground fuel storage tanks and there are no national standards for secondary containment and spill prevention. In addition, there are no regulations that limit the maximum life that a tank can continue to be used. This endangers our rivers, watershed and groundwater.

Monday, June 22, 2015

A Third of the World is Using Up their Groundwater


The Gravity Recovery and Climate Experiment (GRACE) satellite mission from the National Aeronautics Space Administration (NASA) has been collecting data for more than a decade. Two new papers from a group of researchers assembled from the University of California- Irvine, National Taiwan University, and National Center for Atmospheric Research, Boulder Colorado and the Hydrological Sciences Branch at NASA Goddard Space Flight Center have worked in partnership to apply 10 years of collected data to quantify groundwater use, resilience and stability.

The GRACE satellites measure monthly changes in total earth water storage by converting observed gravity anomalies measured from space into changes of equivalent water height this was a method developed by Matthew Rodell & James S. Famiglietti in 1999. The GRACE mission has collected more than ten years of data and the scientists have just completed their analysis of all the data from January 2003 to December 2013. While some preliminary reports have been published in the last couple of years, these two new reports represent a complete analysis of the first 10 years of data. The scientists raise the very real possibility of some groundwater basins running out of water in the near future.

The scientists found that more than one third of Earth's 37 largest groundwater basins are using up their groundwater faster than it is being replaced. Though the GRACE satellites can be used to see the rate of net water consumption, there is little accurate data about how much water actually remains stored in the earth for future us. Eight of the earth’s 37 major groundwater basins were classified as "overstressed," by the scientists. These basins have nearly no natural recharge of the groundwater to offset the ongoing and increasing consumption. Another five groundwater basins were found to be "extremely" or "highly" stressed by the scientists. Those aquifers were still being depleted but had some water flowing back into them. Management of the resource could restore groundwater resilience.

The GRACE data found that the Arabian Aquifer System, an essential water source for more than 60 million people in the Middle East, is the most overstressed aquifer on earth. The Indus Basin aquifer of northwestern India and Pakistan is the second-most overstressed, and the Murzuk-Djado Basin in northern Africa is third. Though California's Central Valley basin is used heavily for agriculture and suffering rapid depletion during the current drought it was found to be slightly better off, but highly stressed. The same was true for the North China Aquifer System and the Tarim Basin. The major stressors for these systems are irrigation and population. The Ganges, the Indus Basin, the Californian Central Valley Aquifer System, and the North China Aquifer System, have the four highest levels of irrigation demand and among the highest levels of population density.

Surface water has throughout history served as the principal freshwater supply used by mankind. However, the importance of groundwater has increased in recent decades as mankind’s demand for water has surpassed surface supplies and our ability to access groundwater has increased with technology. Fresh surface water can no longer support the needs of mankind. Accessing groundwater allowed populations to increase, and provide reliable water as surface water has become less reliable and predictable as weather patterns change and regions experience extended droughts. Regions of the earth have come to rely more heavily on groundwater as a dependable water supply source. Groundwater represents almost half of all drinking water worldwide, though a lesser proportion of irrigation water and is currently the primary source of freshwater for approximately two billion people [Famiglietti, 2015].

Groundwater is a renewable resource, but not in the way that sun light is. Groundwater recharges at various rates from precipitation. To recharge groundwater, it must rain (or snow) and the soil must absorb the water. Changes in rainfall patterns and the actions of man can impact the recharge rate of groundwater. It is known that some groundwater is quite ancient and other groundwater only days old. However, very little actual knowledge exists about global groundwater supplies. Groundwater storage estimates commonly cited in global groundwater assessments were traced to decades-old heuristic estimates. These largely uncertain estimates have been cited as fact so often in the global groundwater literature, and although they were originally only working speculative estimates or assumptions, they have become commonly accepted as fact.

Although there is no measured basis, it is commonly accepted that groundwater comprises 30% of global freshwater calculated from “the upper estimate of global groundwater storage” from a 1978 paper which assumed uniform groundwater supply across the entire global land area. This is not likely to be accurate, but has been used to estimate groundwater supplies in critical regions. Groundwater is an essential portion of the water supply and ecology-providing fresh water and stream baseflow in times of drought. For groundwater to be available to provide in times of drought indefinitely there must be a balance between the volume of water that enters a groundwater system and the volume that leaves the system over time.

The climate of the planet has continually changed over the millennia and some groundwater aquifers are legacies of an earlier climate and are not being recharged. There are some groundwater systems that have no natural recharge; unless they are artificially recharged they have a limited life span. The problem is we do not know how much water is available in the aquifer. If the water from a groundwater basin is used faster than it is recharged, it is being used up and ultimately it will run out. The scientists conclude that significant segments of Earth's population are consuming groundwater more quickly than it is recharging without knowing when it might run out.

Worldwide groundwater is largely unregulated and unmanaged. These two studies highlight regions that may be vulnerable to tipping points to higher ecological, economic and political stress. Potential consequence when an overused aquifer such as the Arabian Aquifer System can no longer supplement declining water supplies are starvation, war and death. Alexandra Richey is the lead author on both studies, conducted the research as a doctoral student and says: "We're trying to raise red flags now to pinpoint where active management today could protect future lives and livelihoods."

These studies highlight regions that may be vulnerable to tipping points toward higher levels of stress driven by a range of factors including conversion to intensified agriculture, or population pressures that increase the demand for water. The lack of ground-based measures of total groundwater availability will prevent a full characterization of aquifer stress and resilience, and the ability to predict critical water stress. To improve groundwater estimates would require a significant investment in regional monitoring and measuring systems to better characterize saturated thickness and soil properties within an aquifer. Water and water availability will drive the political and economic events of the next fifty years.


All this information is from a recently published articles “Quantifying Renewable Groundwater Stress with GRACE” and “Uncertainty in Global Groundwater Storage Estimates in a Total Groundwater Stress Framework” by Alexandra S. Richey, Brian F. Thomas, Min-Hui Lo, John T. Reager, James S. Famiglietti, Katalyn Voss, Sean Swenson, and Matthew Rodell, and published in Water Resources Research in 2015. Like all scholarly, peer reviewed articles this one took several years to go from data gathering to publication so the data collection was from January 2003 through December 2013. These are open access articles.

Thursday, June 18, 2015

Muir Woods a Mere 777 Years Old

Muir Woods is a coastal redwood forest that was designated a national monument in 1908. Muir Woods is located 12 miles north of San Francisco in Marin County in Redwood Canyon two miles inland from the Pacific Ocean. The canyon forms a wetter and cooler micro climate with the moisture from the heavy summer fogs that roll in from the Pacific provide the moisture that has allowed the Coastal Redwoods to grow.

The woods is a beautiful place; silent and majestic on an early spring week day when most tourists are home. It is a place I dragged all my relatives to walk in the woods, picnic and hug a tree when they visited us in San Francisco. Sometimes I would go to the woods to hike the trails and just be alone. I walked the pathway and read the placards several times a year until I knew by heart that the oldest and largest tree in Muir Woods was believed to be more than 1,500 years old. That turns out not to be true.


The age of trees is determined by the counting of tree rings. The science of studying tree ring patterns is called dendrochronology and was created by A.E. Douglas at the beginning of the 20th century. In 1922 he used the methods to date the Giant Sequoias (cousins to the coastal redwoods). In general, each year a tree is alive and grows is marked by a growth ring; the tree gains a little bit of girth though there can be years where rings are absent. The width of the ring added to the outside of the tree is in part dependent on the amount of moisture available to the tree thus trees in the same area add thin rings during dry years and thick rings during wet years. In this way, by examining the rings of a group of trees, the scientists can study the history of the climate and weather in a region.

Researchers from Humboldt State University, University of California at Berkeley and Natureserve were studying the impacts of climate change on redwood growth, carbon storage and forest biodiversity through the Redwoods and Climate Change Initiative (RCCI) one of the many climate change impact funded studies. As part of the study scientists took pencil-thin cross sections from trees to count their growth rings. As mentioned, tree rings vary in width and tell a story of the tree’s growth history and what was happening in the forest during a particular year. Together the tree rings over a region form a catalogue of regional climate.

When Allyson Carroll of Humboldt State University analyzed the data she found that the oldest tree in Muir Woods, the giant 249 foot tall “Tree 76”, is not some 1,500 years old as previously assumed, but a mere 777 years old. The samples were taken in March of 2014 and I was surprised to hear represent the first significant scientific study of the tree canopy at Muir Woods. Besides Tree 76, Ms. Carroll determined the ages of two fallen trees in the forest; the Vortex Tree was 693 years old, and the Solstice Tree, was 536 years old. This leads to the theory that the entire grove is probably younger than previously thought.
From Allyson Carroll Presentation


The new theory of Muir Woods is that some catastrophe likely struck the area; a fire perhaps suggested by burn record, forcing the forest to start again from scratch. Scientists will attempt to use the reconstruction of the past climate to learn how redwoods have responded historically to climate change and assess how the trees are adapting currently.
The Ward Cousins Hugging a Redwood Tree

Monday, June 15, 2015

Ivanpah Solar Thermal Generating Station

The Ivanpah Solar Thermal Plant rises 450 feet above the Mohave Dessert and "power towers" shine with sunlight reflected by 350,000 software controlled mirrors that follow the sun (heliostats) spread across an area of about 3,500 acres. Receivers atop the towers heat to nearly 1,000 degrees Fahrenheit, boiling water to turn turbines that crank out power. At 392 megawatts, the Ivanpah solar thermal plant cost $2.2 billion (or $5,612 per kilowatt) and was intended to produce 940,000 megawatt hours of energy a year. In its first year of operation it produced about 40% of that amount of energy and has been plagued by other problems including massive kills of birds.

Solar thermal creates electricity by using mirrors to direct intense amounts of heat at a centralized collector, which is used to heat a substance like water to create steam and drive a conventional steam power turbine. Solar photovoltaic, meanwhile, directly converts solar energy into electricity through semiconductors. Solar thermal is looking like an Edsel in the dessert and the investors in the solar utility scale photovoltaic systems (who include Warren Buffet) are looking like the smarter investors.

In April 2011, the Department of Energy issued three loan guarantees for BrightSource Energy, NRG Energy and Google totaling $1.6 billion to finance the construction of Ivanpah. BrightSource is a privately held company backed by $615 million in equity from investors including VantagePoint Capital Partners, Google.org, California State Teachers' Retirement System, Morgan Stanley and others. BrightSource began developing Ivanpah and then sold the majority stake in the project to NRG and Google which used the operation to off-set their conventionally generated power used in their data centers.

Though it is difficult to tell from government reports, it appears as if BrightSource Energy Inc. has been able to delayed repaying hundreds of millions of dollars of the project's federal loans for about a year. As of September 2014, the DOE financed projects have repaid nearly $3.5 billion of principal, as well as more than $810 million in interest payments to the U.S. Treasury, which issued the loans guaranteed by DOE through the Federal Financing Bank. In the five years since DOE began financing projects, actual and estimated loan losses are $780 million or approximately 2% of the program’s loans or 3.6% of funds disbursed to date. Not a great performance for a loan portfolio that has not aged, but better than the approximately 5% SBA (Small Business Administration) loan portfolio.

Nonetheless, the Ivanpah loans will be repaid. BrightSource locked in a 20-year power purchase agreements with local utilities that includes fixed pricing, and the vast majority of costs were borne up front, so even with significantly reduced production of power, the marginal cost of that power is very low. That means that the Department of Energy should get its money back as well as interest. It is the rate payers in California that will pay the bill in the end. It is unlikely; however, that there will be further Solar Thermal Installations built. This appears to be a failed technology.

Thursday, June 11, 2015

The G-7 on Climate- Do They Matter?

The annual summit of the Group of Seven (G-7) industrialized countries was held this past week in a resort town in Germany. At the close of the G-7 Summit there seemed to be few areas of clear agreement, but the Leaders of the G-7 nations made a joint statement that deep cuts in carbon dioxide (CO2) emissions were needed this century. They said that the world nations should hold to the upper limit of the United Nations recommendation calling for a 40% to 70% reduction in greenhouse gas emissions by 2050.

German Chancellor Angela Merkel emphasized in her statement that the G-7 leaders had agreed on the need for binding global rules to be developed later this year in Paris. That is a nice sentiment, but the G-7 probably does not have the ability to accomplish that goal or anything close to it. Though the G-7 remains influential, that influence is waning. As the wealth and power of the developing countries grows, the G-7 needs to recognize that it is being eclipsed as the world marches towards multiple and polarized point of power. To reach any world agreement now requires increasing participation of developing countries instead of G-7 authoritarian rule.

The G-7 summit, established in the 1970s to handle the oil crisis, has returned to its original seven members. The G-7 nations are: Canada, France, Germany, Italy, Japan, the United Kingdom and the United States. Together they represent less than 28% of the World’s 2012 CO2 equivalent emissions from fuel and even less in 2015 as China and the emerging nations have continued to grow. In 2012 the Middle East , Russia, Eastern Europe, China, the rest of Asia, Africa and Latin America accounted for 58% of global emissions and an even larger share of the world’s population.


Total CO2 emissions per country is far from the total picture. The picture would change significantly when moving from total CO2 emissions to looking at CO2 emissions per capita or per dollar of GDP (gross domestic product). The charts below show the problem. The CO2 emissions per capita are both an indication of standard of living and energy efficiency. There is some progress that can be made in reducing CO2 emissions by changes in behaviors in the United States without sacrificing the future quality of life of our children and grandchildren. However, life in a a less CO2 emitting United States will look vastly different from today.


World CO2 emissions have grown at an alarming pace over the past fifty years. With tremendous effort and cooperation the nations may be able to halt the growth in CO2 emissions and possibly reduce that slightly, but cutting emissions by 70% in 55 years is unfathomable. While the latest preliminary data on emissions have shown a slowdown in growth, there remain more than 1.2 billion people without access to electricity, or adequate sanitation. If everyone on earth were to have access to electricity and adequate sanitation, CO2 emissions would jump, not fall by 70%.
The International Energy Agency, IEA, will release its 2014 full report on world CO2 emissions from fossil fuel combustion on June 15, 2015. The report will include an analysis of the plans nations have submitted to reduce CO2 emissions, Though the United States and European Union have submitted plans (the European Union's plan is the most ambitious) many nations, including China, have not submitted plans. The current commitments alone can't do it- contain the global temperature rise to 2 degrees Celsius. Stay tuned.

Wednesday, June 10, 2015

Mold in the Richmond Veterans Hospital

According to the Institute of Medicine of the Center for Disease Control and Prevention (CDC) there is sufficient evidence to link indoor exposure to mold with upper respiratory tract symptoms, cough, and wheeze in otherwise healthy people; with asthma symptoms in people with asthma; and with hypersensitivity pneumonitis in people with stressed or compromised immune systems. In addition there is evidence linking indoor mold exposure and respiratory illness. While molds are present at low levels in air, a mold problem in any building can be unpleasant or even sickening to the occupants, but as will be shown below, exposing hospital patients to a “moldy” environment can increase the risk of infection in some patients and therefore requires rigorous remediation.

Last March the McGuire Veterans Administration Medical Center in Richmond, Virginia hired an environmental consulting firm to perform an Indoor Air Quality Assessment in response to complaints from employees and patients about perceive poor indoor air quality and a recommendation from an outside group. The consultants performed a visual assessment of wards 1U, 1V and 1W and the Nurses Stations, checked the filters in the HVAC systems and made sure that the HVAC systems appeared to be clean. They also recorded the Temperature, Relative Humidity, Carbon Monoxide and Carbon Dioxide and used the test device called Micro 5 five minute low volume spore traps to collect 14 interior hallway samples and one exterior sample to measure total airborne fungal spore levels at a particular point in time in an attempt to identify if the hospital had a mold problem that might be impacting the employees and patients.

Currently, there are no federal standards (OSHA, NIOSH, EPA or CDC) for airborne concentrations of mold or mold spores.There are however OSHA , EPA and CDC guidlines for mold remediation wich implicity acknowledges the seriousness of mold contamination. Scientific research on the relationship between mold exposures and health effects continues, but there are yet to be determined absolute levels of exposure that are of no concern and threshold numeric levels likely to impact exposed populations. Molds are part of the natural environment. Molds are fungi that can be found anywhere - inside or outside all year long. About 1,000 species of mold can be found in the United States, with more than 100,000 known species worldwide. In recent years indoor air quality experts, the World Health Organization (WHO), Industrial hygienists and several scientific groups have developed standard approaches to investigating mold problems. Spore traps have become the dominant way of airborne mold sampling, but only test for a handful of spore species that most commonly indicate a problem.

There have been recent papers, presentations, and scientific articles that address whether an interior space is “moldy.” What emerges from these evaluations is that the most common indicator of mold problems in a damp environment is the elevated presence of two related species in particular Aspergillus/Penicillium. These spores are the primary colonizers according to the World Health Organization (WHO – 2009) and often amplify in the indoor environment in response to increased moisture. In addition, it is well documented in studies funded by the National Institute of Health that elevated concentrations of Aspergillus species of fungus in critical-care areas of hospitals, may result in an increased risk of infection in immuno-compromised patients (Kordbacheh et al. 2005; Lee et al. 2007). The CDC states that “the types of health problems caused by Aspergillus include allergic reactions, lung infections, and infections in other organs.” Thus, in the chart below and the discussion that follows, I only examine Aspergillus/Penicillium and total spore count in the 15 samples taken to determine if the sampling results are indicative of a mold problem at the McGuire VA Medical Center in Richmond, VA.
When evaluating fungal spore levels there are three basic approaches to determine if the spore levels measured in a spore trap are of concern: comparing the finding to a reference sample, typically outdoor sample is taken, comparing the value to a control sample from similar building(s) that has not been impacted, or comparing the findings against a data base of mold impacted buildings.

When doing a spore trap sampling it is common with residential and small commercial investigations to sample the outdoor air as a reference sample as was done in this instance. However, air residence time in larger buildings can be hours or several days depending on the size of the building and air flow circulation and whether air filtration systems are operating. In modern buildings with active mechanical ventilation systems the indoor concentration of airborne spore is generally expected to be between 20-70% of the outdoor concentration with an assumed average of 50%. It is important to note that the comparison should be the relative concentration of each spore type and not just the total spore concentration (Spurgeon, 2004). As you can see in the chart above only one sample location (1W-103) had an Aspergillus/Penicillium spore count within the expected range compared to the exterior, all of the other samples were 100% to 2,950%. For the total spore count only the samples with the highest levels of Aspergillus/Penicillium (1U-141 and 1U-138) exceeded the expected range. By comparison to an exterior (reference) sample elevated levels of Aspergillus/Penicillium spores are of concern.

In large commercial complexes control samples can often be obtained from unimpacted buildings or unimpacted wings of buildings. Though the total spore count in most of the samples is significantly below the exterior sample, the elevated levels of Aspergillus/Penicillium and two samples showing elevated total spore levels indicate that there are areas within the building that are more impacted by fungal spores than others. The data indicates a hot spot that is more significantly impacted than other areas, though elevated levels of Aspergillus/Penicillium are ubiquitous. These hot spots should be more fully delineated. Remediation of the area should take place after identifying and eliminating the sources of moisture.

The final method of evaluating fungal spore data is by comparing the samples taken to a database of sampling results for buildings that have been tested. The concentration of airborne contaminants can be characterized by a lognormal distribution with a geometric mean concentration and standard deviation. Joe Spurgeon, PhD, CIH performed an analysis on the data from three studies to find the Aspergillus/Penicillium level for a “moldy” environment. Dr. Spurgeon created the table below from three separate groups of data:

Aspergillus/Penicillium levels considered as indicative of a “moldy” environment from three independent studies:

1. Baxter data: Asp/Pen ≥ 950 spores/m3
2. Rimkus data: Asp/Pen ≥1,000 spores/m3
3. Spurgeon data: Asp/Pen ≥ 1,000‐1,100 spores/m3

The sample from 1U-141 location would be classified by this database comparative approach as a moldy environment. In addition, that sample was in the 95-99 percentile for Aspergillus/Penicillium compared to all building samples represented in the database. Clearly the extent and source of the Aspergillus/Penicillium fungal spores needs to be identified, isolated and remediated.

In all methods of evaluation, the levels of Aspergillus/Penicillium identified at the McGuire VA Medical Center indicate a localized but significant mold problem that might impact the health of patients and staff. Additional tests should be performed to delineate the extent of the problem. The area of impact should be remediated following U.S. EPA and the CDC guidelines and confirmation testing performed. It is my understanding that the on-site Administrator has chosen to take no action, but this could potentially impact the health and comfort of the staff and our most vulnerable patients.

While there are currently no  federal regulations setting a threshold level for mold concentrations that would require remediation, available research shows that such a level is already and increasingly knowable. It is only a matter of time until such knowledge is embodied in a regulation and it is better to act now on what we already now then to risk harm while awaiting regulation to force action. We have established the Veterans Administration hospital system especially for veterans due to their extraordinary service to our county and a problem like this which puts their heath at further risk should not be ignored. In Pittsburgh, PA hospital patients died of mold infections. 

Monday, June 8, 2015

EPA Reports on Fracking and Water

Last Friday the Environmental Protection Agency (EPA) finally released the draft assessment of the potential impacts of hydraulic fracturing and its related activities on drinking water resources in the United States.

fracking water cycle from EPA
This assessment was done at the request of Congress and found that while 25,000-30,000 new wells were developed using hydraulic fracturing each year between 2011 and 2014 and added to the more than 250,000 wells that were fractured in 25 states between 1990-and 2013 there have been few cases of impacts on drinking water resources.

They examined all the potential vulnerabilities in the water lifecycle that could impact the 6,800 potential drinking water sources for the 9.4 million people living within one mile of a hydraulically fractured well.  EPA’s assessment relies on existing scientific literature and data. Literature evaluated included articles published in science and engineering journals, federal and state government reports, non-governmental organization (NGO) reports, and industry publications. Data was gathered from databases maintained by federal and state government agencies, other publicly-available data and information, and data, including confidential and non-confidential business information, submitted by industry to the EPA. The list of seemed fairly thorough and covered all the information and data currently available.

EPA concluded that there are above and below ground ways that hydraulic fracturing can potentially impact drinking water resources. These mechanisms include water withdrawals in times of drought, or in areas with, limited water availability; spills of hydraulic fracturing fluids and produced water; fracking directly into underground drinking water resources; below ground migration of liquids and gases from inadequately cased or cemented wells; and inadequate treatment and discharge of wastewater.

EPA did not find evidence that there has been widespread impacts on drinking water resources; on there contrary, they found that surface spills of fracking fluid or recovered and produced water were the most common source of potential water contamination. EPA did find specific instances where one or more failures in design, well completion and fluid storage led to contamination of drinking water wells. The number of identified cases, however, was very small compared to the number of hydraulically fractured wells. While this could be interpreted as an endorsement of the overall safety of fracking, it may also be due to insufficient pre- and post-fracturing data on the quality of drinking water resources; the lack of long-term systematic studies of areas that have been fracked and the presence of other sources of contamination precluding a definitive link between hydraulic fracturing activities and an impact when using fracking to redevelop and extend the life of existing oil and gas wells. .

The assessment follows the water used for hydraulic fracturing from water acquisition, chemical mixing at the well pad site, well injection of fracking fluids, the collection of hydraulic fracturing wastewater (including flowback and produced water), and wastewater treatment and disposal. Though cumulatively, hydraulic fracturing used on average 44 billion gal of water a year in 2011 and 2012, this represented less than 1% of total annual water used in the United States. However, in areas of drought the need for a median of 1.5 million gallons to frack a well could impact water supplies. EPA disclosed that in 2011 and 2012, water used from fracking represented 30% or more of total water used in 33 or 2.2% of counties, and 50% or more in 15 or 1.0% of counties.

The median amount of water used to frack a well covers a variety of well types including vertical wells that used much less water than the estimated 4 million gallons necessary to frack a horizontal well. The amount of water necessary is determined by well length, formation geology and the fracking fluid formulation. Interestingly enough in the generally water rich Marcellus shale in Pennsylvania, much less of the fracking water is returned to the surface and most is recycled resulting in 18% of the water used in fracking is recycled water. This simplified the fracking fluid disposal problem in an area without underground disposal wells.
Fracking water budget in Marcellus Shale from EPA

EPA found that surface spills were by far the most common incident reported. The reported volume of fracturing fluids or chemicals spilled ranged from 5 gallons to more than 19,000 gallons, with a median volume of 420 gallons per spill. Spill causes included equipment failure, human error, failure of container integrity, and other causes (e.g., weather and vandalism). The most common sited cause was equipment failure. The frequency of on-site spills from hydraulic fracturing could be estimated for only two states. If the estimates are representative, the number of spills nationally could range from approximately 100 to 3,700 spills annually, assuming 25,000 to 30,000 new wells are fractured per year.

EPA identified a list of 1,076 chemicals used in hydraulic fracturing fluids over multiple wells and years. These chemicals include acids, alcohols, aromatic hydrocarbons, bases, hydrocarbon mixtures, polysaccharides, and surfactants. According to the EPA’s analysis of disclosures, the number of unique chemicals per well ranged from 4 to 28, with a median of 14 unique chemicals per well. In addition, EPA reports an estimated 9,100 gallons of chemicals are mixed with the median 1.5 million gallons of water per well. Given that the number of chemicals per well ranges from 4 to 28, the estimated volume of chemicals injected per well may range from approximately 2,600 to 18,000 gallons.

EPA found that groundwater can be impacted by fracking fluids or methane gas if the casing or cement on a well are inadequately designed or constructed, or fail. A study done in the Williston Basin in North Dakota suggests that the risk of groundwater contamination from leaks inside the well decreases by a factor of approximately one thousand when the well casing extends below the bottom of the drinking water aquifer.

EPA suggests that fracking of older wells to restore production can contribute to casing degradation and failure, which can be accelerated by exposure to corrosive chemicals, such as hydrogen sulfide, carbonic acid, and brines. No data was provided on this risk. The study found that one of the best protections for groundwater is the physical separation between the gas production zone and groundwater resources. Many hydraulic fracturing operations target deep formations such as the Marcellus Shale or the Haynesville Shale, where the vertical distance between the base of drinking water resources and the top of the shale formation may be a mile or greater.

Not all hydraulic fracturing is performed in zones that are deep below drinking water resources, but should be. The EPA’s survey of oil and gas production wells hydraulically fractured in 2009 and 2010 estimated that 20% of 23,000 wells had less than 2,000 feet of vertical separation between the point of shallowest hydraulic fracturing and the base of the protected groundwater. There are also places in the subsurface where oil and gas resources and drinking water resources co-exist in the same formation. Evidence indicates that hydraulic fracturing occurs within these formations. This injects of fracturing fluids into formations that may currently serve, or in the future could serve, as a source of drinking water for public or private use and should not be allowed.

Water, of variable quality, is a byproduct of oil and gas production. After hydraulic fracturing, the injection pressure is released and water flows back from the well. Initially this water is similar to the hydraulic fracturing fluid, but as time goes on the composition is affected by the characteristics of the formation and possible reactions between the formation and the fracturing fluid. EPA calls all this water produced water. EPA reported many more organic chemicals used in hydraulic fracturing fluid than have been identified in produced water. The difference may be due to analytical limitations, limited study scopes, and undocumented subsurface reactions. This seemed to suggest the need for more extensive analysis. 

The final area that EPA looked at was management of the produced water. Hydraulic fracturing generates large volumes of produced water that require management. In 2007, approximately one million active oil and gas wells in the United States generated 2.4 billion gallons a day of wastewater. It is unknown what portion of this total volume is produced by hydraulically fractured wells, but really, after the flowback period there is little difference.

As is pointed out in the report wastewater management and disposal could impact drinking water resources. Inadequate treatment of wastewater could result in discharge of contaminated water to rivers and streams. In addition, spills can occur during transportation of wastewater away from the well head or spills and leaks from wastewater storage pits. Also, migration of contaminants from inappropriate use of land application to dispose of of wastewater, and other inappropriate methods of wastewater treatment. 

EPA states that it is unknown whether advanced treatment systems are effective at removing that may be present in produced water and are simply not tested for. The biggest concern in the field for produced water seemed to have been concern with total dissolved solids rather than overall contaminant concentration. Radionuclides  have been found in inadequately treated fracking wastewater from the Marcellus Shale. Research in Pennsylvania found the accumulation of radium in sediments and soils near the outfalls of some wastewater treatment plants that had handled oil and gas wastewater. Sending fracking wastewater to POTWs in Pennsylvania is no longer allowed. There is no data on most of the 1.076 chemical that might have been used in fracking fluid, but are not tested for as part of the Safe Drinking Water Act 82 parameters or POTWs permits..

The take away is there is still the need for more research to be able to fully model and understand fracking. In addition there is a need for more extensive baseline studies prior to drilling and long term monitoring to even know if water (or human health) has been impacted by fracking. Predrilling data needs to include measurements of groundwater and surface-water quality and quantity. There have been virtually no comprehensive studies on the impact of fracking on human health while state regulators and laws in some instances allow fracking virtually in people’s backyards and without adequate vertical separation from groundwater supplies. Fracking needs to be well understood and the risks managed to make sure that is a boon to mankind and only is used in appropriate geology and low risk locations. The draft report will be finalized after an 85 day comment period. To submit a comment go to http://yosemite.epa.gov/sab/sabproduct.nsf/fedrgstr_activites/HF%20Drinking%20Water%20Assessment?OpenDocument


Thursday, June 4, 2015

Retesting for Coliform after Treating My Well


Almost three weeks after chlorine shocking my well I tested my well for coliform bacteria and it was absent. That is a really good sign, but not a full bill of health-yet.
IRL it looks more like white wine than this

This past spring when I tested my well water I found coliform bacteria present. Coliform bacteria are commonly found in soil, on vegetation, and in surface water. They also live in the intestines of warm-blooded animals and humans. Some coliform bacteria strains can survive in soil and water for long periods of time. Coliform bacteria do not usually cause illness. However, because coliform bacteria can be associated with sewage or surface waters, the presence of coliform bacteria in drinking water indicates that the well water may not be sanitary, other disease-causing organisms (pathogens) may be present in the well and water system.

There are three different groups of coliform bacteria; total coliform, fecal coliform and Escherichia coli (E. coli) each has a different level of risk. Total coliform serves as a proxy for fecal coliform and E. coli bacteria. My well was found to be contaminated with coliform but not E. coli or fecal coliform, so I had a nuisance bacteria problem. In many instances total coliform contamination are introduced in the well or plumbing system through damaged parts of the system or during repairs and do not originate in the water supply.

This was the first time that a water test found coliform bacteria present in my well water. I had replaced my damaged well cap over the winter so it was likely that the coliform bacteria had entered the well during that time. Coliform bacteria do not occur naturally in most aquifers. However, fractured or creviced bedrock groundwater aquifers can have naturally occurring coliform bacteria.

In an existing well system that formerly was bacteria free and has only coliform bacteria look first for defects. These include: openings at the top of the well; damaged or improperly sealed well cap, old, rusty, or damaged well casing; unprotected suction line; buried wellhead; damaged grouting: or pooling of water near the well head after storms because the source of the coliform bacteria may be infiltration from the surface from rain or snow melt.

I carefully checked the well and water system for points of contamination and repacked the soil around the well pipe to make sure it flows away from the well as much as possible. My well cap was installed last winter, so the new cap was still in excellent condition, I made sure it was tight, sound and clean.

Though it is standard procedure to retest a well before treating it, I immediately treated the well and plumbing system with 100-150 ppm chlorine for 16 hours to disinfect system. The reason I went to immediately disinfecting my well is that treating a well with chlorine also cleans out the well and eliminates iron reducing bacteria that I have had problems with in the past. I had actually been thinking of treating my well with chlorine sometime this year anyway.

After almost three weeks (because I went to visit my family for a few days) I retested the water for coliform bacteria using a home test kit from Enviro TestKits. I still have half a dozen sealed DIY bacteria test kits (several were used for other people’s houses) so I plant to test my well after the next big rainstorm and in another month. If coliform bacteria remains “absent” I’m done. If not, then it is time to install a long term disinfection system. No fooling around, I am responsible for ensuring that my family has safe and clean drinking water.


Monday, June 1, 2015

Regulating Your Garden Under the Clean Water Act

On Wednesday May 27th. 2015, the U.S. Environmental Protection Agency (EPA) and the Army Corps of Engineers released the long anticipated rule to expand protection and regulation under the 1972 Clean Water Act to include streams and wetlands and any body of water that the EPA previously needed to determine to be a “significant Nexus” to the “navigable waters of the United States” on a case by case basis. Though the new rule excludes artificial ponds and lakes on private property along with ditch systems that do not convey downstream, it expands the regulated community to individual property owners ill equipped to understand, comply with or fight federal regulations.

Slightly more than a year ago, the E.P.A. and the Army Corps of Engineers jointly proposed the original version of this rule, known as Waters of the United States,. Since that time the EPA has held more than 400 meetings about it with outside groups and read more than one million public comments (including a social media campaigns that according to the New York Times was orchestrated by the EPA and Farm Bureau) as it wrote the final language for the rule. Now, the White House has announced that the rule as will be implemented under executive authority of the President. It is expected to face fierce opposition and legal challenges, since executive authority and legal challenges seem to be the way that laws are made these days.

According to the EPA the Clean Water Act protects navigable waterways and their tributaries. The new rule says that a tributary must show physical features of flowing water (as determined by a regulator). The rule protects waters that are next to rivers and lakes. The rule protects prairie potholes, Carolina and Delmarva bays, bogs, western vernal pools in California, and Texas coastal prairie wetlands when they impact downstream waters (as determined by regulators). The rule protects ditches that are constructed out of streams or function like streams and can carry pollution downstream (as determined by regulators).

While the new rule limits the analysis necessary to declare that water will impact the navigable waters of the United States, it greatly expands the waters included by regulation. According to the EPA blog, the following impact the Navigable Waters of the United States and are included in the rule by assumption.
  • Streams, regardless of their size or frequency of flow. Seasonal streams are included in the regulation.
  • Wetlands and open waters in riparian areas and the 100 year floodplains are included in the rule.
In addition, many wetlands and open waters located outside of riparian areas and 100 floodplains may provide functions that could benefit rivers, lakes, and other downstream waters, even where they lack surface water connections and may be included in the rule. These include but are not limited to prairie potholes, Carolina and Delmarva bays, bogs, western vernal pools, and coastal prairie wetlands and other habitats that have a water component like man made ditches that connect to streams, wetlands or riparian areas.

The EPA news release called this a new era in the history of the clean water act and described the rule as "an action to clearly protect from pollution and degradation the streams and wetlands that form the foundation of the nation’s water resources." It is certainly a new era in regulation. We have created a system where administrators run and control everything under “laws” that no one understands or are fully aware of. If property owners fail to apply for permits to build, till, develop or perform “other potentially polluting activities” near water bodies, they can be sued by the EPA. Environmental activist groups, and even private citizens will be able to bring lawsuits against landowners who might be in violation of the regulations. The problem is the grey areas of the rule create a system of arbitrary administrative or political power. There is little doubt that some polarising or controversial figure will find himself in felony violation of the Clean Water Act. The rule of law is dead. There is no bright clean line that any citizen could understand and yet any citizen could carelessly committee a felony during a weekend of gardening. There is no deminimus standard in the rule and it can be applied at will.

For several years EPA has attempted to expand the reach of the Clean Water Act to all waters and discharges to include all sources. Federal authority has never before extended to non-point sources, such as from run off from agricultural and urban sources not part of a storm sewer system as well as other small sources such as septic systems, vegetable gardens, backyard chickens etc. The EPA has been frustrated in their attempts to address what they view as the current generation of environmental problems. These problems are subtle, much less visible to the naked eye and often not recognized because they are from diffuse or non-point sources.

Agriculture is reported to be one or the main non-point sources of water pollution and in studies done in the Chesapeake Bay Watershed and Sacramento River Delta and other locations the contamination from agriculture runoff has been the major source of contamination. Pesticide runoff is a large contributor of known pollutants to the watersheds and may be a significant contributor of endocrine disruptors to the freshwater supply, but so are suburban lawns and gardens. Now, EPA has expanded the Clean Water Act reach to all water and all sources of water pollution no matter the size and location.

Farmers fear that the rule could impose major new costs and burdens, requiring them to pay fees for environmental assessments and permitting just to till the soil near ditches or dry stream beds where water flows only when it rains. A permit is required for any activity, like farming or construction, that creates a release or discharge into any body of water covered under the Clean Water Act or impacts the health of the body of water. These regulations apply equally to a small, herb and vegetable gardens. Will I get my water discharge permits the same place I buy my plants? Now there is a business opportunity, discharge permits for homeowners.

EPA has expanded their authority to every bit of water in the US and will be able to directly regulate all sources of pollution without working through the states. This rule will be felt throughout the U.S and in all areas of our economy and lives not previously directly touched by the EPA. It will have a profound impact on many previously locally regulated activities, including home building, mining, road construction, commercial property development and water infrastructure projects and very small scale projects and even gardening or pesticide application by homeowners. The capricious application of the federal command and control regulatory scheme will directly impact all our lives, determine what we may do on our properties and change the very nature of our nation.
Note the drainage ditch coming off the road and traveling down the driveway

Pulling back you can see that the water can travel down hill to the stream