Showing posts with label NOAA. Show all posts

Monday, April 22, 2013

Global CO2 Soars Past 400 ppm


Data from IEA
The International Energy Agency (IEA) released their 2012 edition of the CO2 Emissions from Fuel Combustion Statistics Highlights. World CO2 (carbon dioxide) levels have climbed past 396 ppm (parts per million) in the atmosphere and will hit 400 ppm in early spring before retreating slightly over the summer. Global CO2 emissions have grown by 47% since 1990 (based on IEA estimates for 2011). The CO2 levels on earth had averaged 280 ppm for hundreds of thousands of years, but in the past century they began rising. 

As the concentrations of CO2 in the atmosphere increase the warming produced by the greenhouse gas effect is strengthened. Computer modeling of the climate predicts that there will be feedbacks that significantly increase the impact from the increasing CO2. This is a feedback control loop on a global scale. Mankind produces carbon dioxide from power plants, transportation (cars, trucks, planes, trains, and ships), heating, cement manufacture, deforestation, and breathing. Methane is produced from agriculture, livestock, mining, gas pipeline leaks and well heads, landfills, and sewage plants. Nitrous oxide is produced by fertilizers, fossil fuel combustion, animal waste, polluted waters, and chemical processes. CO2, methane, nitrous oxide and water vapor are the major greenhouse gases. The IEA tells us that 65% of the global greenhouse gas emissions by mankind are from the burning of fossil fuels for energy production and in industrialized nations 83% of all greenhouse gas emissions are from power generation, heating and cooling and transportation, but it is clear that both population and industrialization drive CO2 production.  
Data from IEA
The climate models show that there is nothing that we can do to stop global warming and climate change. Even if the concentration of CO2 in the earth’s atmosphere were to stabilize at this level, global warming and sea level rising would continue for hundreds of years because of the time scales associated with climate and planetary feedback loops. In reality, the global emissions of CO2 will continue to rise for at least a generation. What is going to happen will happen. I will leave it to others to argue the case for the accuracy of climate models; however, both mankind and the earth itself will respond to changes in CO2 concentrations and temperature, but not before it becomes the pressing concern of the currently emerging nations. Though we constantly argue, discuss and meet, there is virtually nothing we can do to change what is going to happen in the next dozen generations. We can hope that mankind will move to a more sustainable course without the need for catastrophe to motivate us, but that will not change what is going to happen. 
Sorry, the scale is off.  I could not get 2011 to slide over. 
We need to face some tough realities. We cannot even stabilize the world CO2 emissions. As each region or county industrializes the world CO2 emissions have grown. World CO2 emissions are 146% of 1990 levels. Europe has stabilized their emissions and with effort under the Kyoto Treaty has decreased them 2.8% from 1990 levels. The U.S. seems to have finally begun its stabilization and reduction process in the past few years, but since 1990 has increased emissions by 9.5%. The far more populous emerging nations have blown past us in CO2 emissions. Asia (including India) has increased their CO2 emissions by 270% since 1990, and China has increased their CO2 emissions by 352% since 1990. Once the phenomenal growth in their economies that has driven the growth in CO2 emissions, slows down, the C02 emissions will stabilize at a higher level. As a county industrializes its emissions rise as Industrialization typically begins with coal fired power generation. Though coal fired power plants produce twice the CO2 as gas fired power plants they are the source of most power in China and India and still provide over 42% of power generation in the U.S. Nonetheless, except for the fall the Russian Federation, the CO2 emissions of a region or nation do not fall significantly. When populations get cars, homes with heating, air conditioning, on-demand water and power- become first world nations, they like to stay that way.

Monday, February 18, 2013

Meteorite Slams into Russia-Didn't See That Coming

The GIF animation below comes from NOAA and consists of 8 separate images captured by satellites in 15 minute increments until the vapor trail blends into the reflected light of the morning sun.

NOAA Environmental Visualization Laboratory - Meteorite Slams into Atmosphere Above Chelyabinsk, Russia

On February 15, 2013 at around 9:20 am local time a meteor entered the atmosphere above Chelyabinsk, Russia. According to the revised information from the NASA Jet Propulsion Laboratory, in Pasadena, California, the meteor was 55 feet in diameter and had an estimated mass of 10,000 tons. The meteor was traveling at about 40,000 miles per hour when it entered the atmosphere, streaking across the sky for 32.5 seconds, releasing a sonic boom that blew out windows and doors and exploded in the atmosphere above the earth. The meteor was a made of rock material that grazed the atmosphere and exploded into what scientists expect to be a large number of meteorites. Scientists now believe that 500 kilotons of energy was released in the explosion. This is more than 33 times the size of the explosion at Hiroshima during World War II. Peter Brown, a scientist at the University of Western Ontario, Canada used infrasound data collected from monitoring stations around the world to estimate this information. Infrasound data is monitored around the world to monitor for nuclear testing to ensure compliance with nuclear treaties.

Scientists had been monitoring the sky for the 2012 DA14 asteroid that had been discovered in 2012 and was scheduled to make a close pass by earth on the same day, but did not see the Russian meteor coming because it was coming from the east- the daylight side. The trajectory of the Russia meteor was significantly different than the trajectory of the asteroid 2012 DA14, which hours later made its flyby of Earth, making it an unrelated coincidence. The 2012 DA14 meteor was a 130,000 ton 150 foot diameter meteor that passed 17,200 miles above earth without event.

The Russia meteor is the largest reported meteor strike since 1908, when a meteor hit Tunguska, Siberia, but meteors strike earth all the time. Most are small and burn up in the upper atmosphere, some are seen in the night sky as shooting stars.  These days satellites monitoring the earth for missile launches and the infrasound monitoring stations can quickly identify a large meteor strike, but in earlier times large meteors could have struck the earth in uninhabited areas or the ocean and been unnoticed. Small meteor fragments do occasionally strike earth (becoming meteorites by hitting earth) and injure a couple of people, but nothing on the magnitude of this meteor where over 1,000 people were reported to be injured from broken glass and the damage of doors and windows blown out by the sonic boom. NASA states that though meteorites strike earth daily, a meteor of this size is a once in a century event with even larger hits occurring every couple or more millennium.  

Thursday, September 27, 2012

The CO2 Tipping Point Not Yet Reached- Oceans and Vegetation Absorb More Carbon

The International Energy Agency, IEA, estimates that world CO2 emissions from fossil fuel combustion rose by 1 billion metric tons in 2011, a 3.2 % increase over 2010 to reach 31.6 billion metric tons (34.83 billion tons). In 2011 the top four world generators of CO2 emission from fossil fuels were in descending order China, the United States, the European Union and India who edged out Russia to take the number four slot. China contributed almost three quarters of the global increase, with its emissions rising by 720 million metric tons, or 9.3% to 8.46 billion metric tons of CO2, primarily due to higher coal consumption to produce electricity. Increases in the CO2 emission from fossil fuel combustion in 2012 is likely to be less since electricity use in China is up only 1% this year.

Nonetheless, the world CO2 emissions continue to increase. IEA not only collects data it also makes progress reports, and makes recommendations for implementing carbon dioxide controls worldwide to preventing the world from reaching the “Tipping Point” where global temperatures cannot be held within 2°C above pre-industrial levels. Initially, the climate science establishment thought the Tipping Point would be reached when world CO2 emissions from burning fossil fuel reached 32.6 billion metric tons of CO2 annually and global CO2 concentrations reached 450 parts per million. The “Tipping Point” was the 450 Scenario which limits global warming to 2 degrees by limiting concentration of greenhouse gases in the atmosphere to around 450 parts per million of CO2. We are currently very close to the 32.6 billion metric tons (just 1 billion metric tons above 2011 levels and the amount the world emissions increased last year.) However, though the atmospheric concentrations of CO2 continue to rise, the National Oceanic & Atmospheric Administration, NOAA, reports that CO2 concentrations have risen just 2.33 parts per million to 392.41 parts per million from August 2011 to August 2012.

Despite sharp increases in carbon dioxide emissions from burning fuel the level of carbon dioxide in the atmosphere has not increased as quickly. There appears to be a buffer provided by Earth’s vegetation and oceanswhich continue to soak up about half of the carbon dioxide emissions each year (though of course impact on marine ecology should be of concern) according to arecently published study led by the University of Colorado at Boulder. The study, led by Dr. Ashley Ballantyne, looked at global CO2 emissions reports from the past 50 years and compared them with rising levels of CO2 in Earth’s atmosphere during that time. The results showed that while CO2 emissions had quadrupled, natural carbon “sinks” that sequester the greenhouse gas doubled their uptake of CO2 in the past 50 years, potentially lessening the warming impacts on Earth’s climate.

The study showed global CO2 uptake by Earth’s sinks essentially doubled from 1960 to 2010, although increased variations from year-to-year and decade-to-decade suggests some instability in the global carbon cycle. According to the study, CO2 uptake by Earth’s land and oceans decreased in the 1990s (when most of the climate models were developed), followed by increased CO2 sequestering by the planet from 2000 to 2010. “Seeing such variation from decade to decade tells us that we need to observe Earth’s carbon cycle for significantly longer periods in order to help us understand what is occurring,” said Dr. Ballantyne. Marine Biologists are deeply concerned about the impact of increasing uptake of CO2 by the world’s oceans. Dissolved CO2 in the ocean forms carbonic acid making the oceans more acidic and damaging coral, the fundamental structure of coral reef ecosystems that harbor 25% of the world’s fish species.Take a look at the article in Nature (if you want to spend the money).

Monday, June 4, 2012

Lightning Rods and Lightning Protection Systems-Should You Have One?


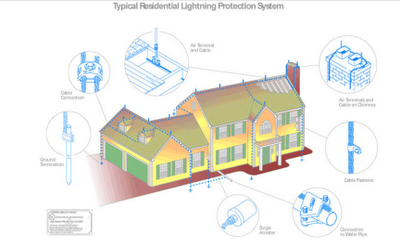
The image is from Lightning Prevention Systems, Inc. in New Jersey a state that has only about 45,000 lightning strikes a year

Though summer is the peak season for lightning, it does strike year round. According to the National Oceanic and Atmospheric Administration (NOAA) 25 million cloud-to-ground lightning strikes occur in the United States each year. Generally speaking lightning strikes are geographically concentrated in the southeast, south and mid-west. Until we moved to Virginia (with an annual average of 344,702 lightning strikes a year) from California, I had not thought much about lightning. Texas is that state with the most lightning strikes a year averaging almost 3 million a year and much smaller Florida 1.4 million strikes a year! The creation of lightning is a complicated process. According to NOAA we know what conditions are needed to produce lightning, but there is still debate about exactly how lightning forms. The exact way a cloud builds up the electrical charges that lead to lightning is not completely understood. A channel of negative charge, called a step leader, shoots to the ground in a zigzag of roughly 50-yard segments in a forked pattern. As it nears the ground, the negatively charged step leader is attracted to a channel of positive charge from the earth reaching up, a streamer, normally through something tall, such as a tree, house, or telephone pole. When the oppositely-charged leader and streamer connect, a powerful electrical current begins flowing. A flash can consist of one or as many as 20 return strokes.

Cloud to ground (CG) discharges, are the most common, but there are other known types of lightning that have no channel to ground.  These cloud discharges are classified as in-cloud (IC), cloud to air (CA), or cloud to cloud (CC). There is also lightning that originates at the top of the thunderstorm. This area carries a large positive charge. Lightning from this area is called positive lightning that frequently strikes away from the rain core, either ahead or behind the thunderstorm. It can strike as far as 5 or 10 miles from the storm, and is it typically has a longer duration, so fires are more easily ignited. Positive lightning usually carries a high peak electrical current, which is more likely to kill.

 The air within a lightning strike can reach 50,000 degrees Fahrenheit, and one ground lightning stroke can generate between 100 million and 1 billion volts of electricity. Lightning is a major cause of building fires, even though highly effective (though not perfect) protection has long been available. In the 1700s Benjamin Franklin (remember the kite and key story) proposed a method of protecting structures from the effects of lightning using elevated rods and down-conductors. His ideas were furthered by the work of Nikola Tesla, Michael Faraday and other scientists to develop and document successful designs. In 1904, The National Fire Protection Association, NFPA, established the American standard for installation of lightning protection systems now known as NFPA 780- the Standard for the Installation of Lightning Protection Systems. Historical documentation shows that fire losses to protected buildings were between 1.3%-7% of the damage to unprotected buildings during the first two decades of the twentieth century as the standard developed and our knowledge increased. Experience of the fire-insurance companies showed that if buildings were properly "rodded", they would be practically safe from damage by lightning. Remember this is based on statistics lightning is most likely to hit the highest object, and is also more likely to strike something with a good path to ground, such as a lightning protection system.

Installation of such a system in conformance with NFPA 780 is not a simple matter and can cost thousands of dollars depending on the size and shape of the house. Whether it makes economic sense for you depends on many factors such as location, value of the property in dollars and sentiment, insurance and the amount of the deductible, what you can afford and how you feel about lightning. My husband and his brother who grew up in the same house that was struck by lightning came to different decisions.  To provide effective protection for structures, a lightning protection system must include a sufficient number of rods with tips exposed and extending above the structure. These lightning rods, now called air terminals become the preferred strike receptor for a descending step leader from the thundercloud. That rapidly-varying lightning current must then be carried away from the building into the earth through a down conductor system, that will provide the path of least resistance and impedance to the flow of current must be so low that "side flashes" to other objects in the vicinity of the system do not occur. It is essential that the system is designed to prevent it from heating or dislodging from the structure by the force of the power surge. All nearby metal components of the structure (solar panels, generator, roof vents, water and sewer pipes etc.) must be properly connected to the down-conductor system to minimize the probability of side flashes and ensure the flow of current to the earth. The connections from the down conductors to the earth must allow the lightning current to flow into the ground without the development of large electrical potential differences on the earth's surface and without creating other hazards.

To verify that an existing system is designed and installed correctly you could have it certified. Certification of a lightning protections system assures that the system meets the standards set forth by NFPA 780 and the Underwriter's Laboratories (UL 96A). If like me you are going to install a lightning protection system make sure your designer and installer has at least his Journeyman Installers certification from the Lightning Protection Institute, LPI and/or certified by Underwriters Laboratories. Journeyman Installers must pass two levels of tests for LPI Certification. Master Installers must pass a series of four tests, and carry a brass card issued by LPI. Annual re-testing is required for continued certification. There is also a Master Installer and Designer designation- that might be the best choice. You can go the LPI web site to obtain a list of certified installers in your area. Likewise you can go to the Underwriters Laboratories website for a list of certified installers. Many counties do not require a building permit to install a lightning protection system. Without the help of the county building department staff you will have to make sure that your system is designed and installed in conformance with NFPA 780 or UL96A there are differences between the standards, but they are similar in many ways.  The American Society for Agricultural Engineers (ASAE) Standards also has specification for lightning protection though they are geared to farms, the principals are the same. ASAE develops and publishes consensus standards for agricultural tractors and machinery, agricultural structures, turf and landscape equipment, irrigation and drainage equipment and systems, environmental aspects of food production and resources management. In addition, you might want to take a look at other installation jobs and make sure that they are as unobtrusive as possible. Aluminum cables are likely going to be run across your roof and down the sides of your house in addition to installing a rod on every gable and at least every 20 feet along a roof span. Check for a valid contractor’s license, references and the Better Business Bureau.

Though copper with 98% conductivity when annealed, is the preferred material for lightning protection on farm structures. Alloyed metals are typically used today. Aluminum while having only 59% the conductivity of copper is acceptable as a substitute for copper in lightning protection when electrical grade aluminum is used.  Aluminum is subject to corrosion by ocean air or soil, but resistance in other environments can be excellent due to a thin surface layer of aluminum oxide that forms when the metal is exposed to air, effectively preventing further oxidation. Aluminum is preferred on structures with aluminum trim to prevent corrosion from the reaction of the aluminum coming in contact with copper wires- add rain to copper and aluminum and you are making a battery.

The lightning protection system must terminate into the earth to dissipate the charge using a copper clad steel cable. The slightly acidic nature of the soil will corrode the aluminum and impede system performance. The choice of material used on the structure is based on cost, and the other materials of construction- copper has less resistance than aluminum, but can have other problems other than cost. The down conductors should be as widely separated as possible and each building must have at least two, but there should be at least one down conductor for each 100 feet of perimeter. Usually aluminum is used against the house because copper gutters are not as common these days, aluminum is much cheaper and so bi-metal connectors must be used to make the transitions into the copper clad steel cable in the earth to assure proper grounding and dissipation of the lightning. Also bi-metal transition connectors must be used if the air terminals are copper. Underground metallic piping, including water piping, well casings, sewer and septic lines must be considered in the design or they are potential points of failure. Lightning arresters should also be installed on the lead-in wire or cable for the electrical supply and bonded to the lightning protection system directly or through a common ground. NOVEC, my power company, offers to install and maintain a “collar” system at the electrical meter for $10 per month or you can purchase separate surge protectors.

In summary, all the science and experience of century prove that properly designed and installed lightning protection systems work, though there is still some dispute about the most effective design theory. Each year, lightning is the cause of an estimated 17,400 fires 55% of which occur outdoors, and 41% occur inside structures. According to Federal Emergency Management Agency, FEMA, dollar loss per fire is nearly twice that from all U.S. fires and in 1998 that was around $10,000 and probably close to double that now. Roofs, sidewalls, framing, and electrical wires are the areas most ignited by lightning fires. Though a lightning protection system will have little or no effect on how likely it is that lightning will strike in the immediate area, the energy will be conducted directly to ground, without having to go through your house, its internal wiring and electrical equipment and appliances. Whether it makes sense to install one is an economic decision based on where you live, your insurance deductible and other factors. Our very high insurance deductible combined with the irreplaceable paper book collection that is the centerpiece of our lives would not survive a fire caused by a lightning strike or the water and mold associated with fire response. So, even with a cost of thousands of dollars, we will install one here in Virginia.

Thursday, January 7, 2010

Methane and Global Warming

During the Copenhagen meeting almost unnoticed Robert Watson, the former chair of the Intergovernmental Panel on Climate Change and Mohamed El-Ashry, a senior fellow at the United Nations Foundation along with a group from the scientific and financial communities proposed the creation of a Global Methane Fund. According to this group, targeting methane reduction would be a cost effective and results oriented way to prevent global warming. Methane, one of the "other greenhouse gases," is reportedly responsible for 75% as much warming as carbon dioxide measured over any given 20 years. Unlike carbon dioxide, which remains in the atmosphere for hundreds of years, methane lasts only a decade so reductions in methane release will see climate results within a decade as the total methane in the atmosphere is reduced. According to NOAA, National Oceanic and Atmospheric Administrations, CH4 which absorbs 25 times the heat of CO2 is present in the atmosphere at 1/50 the level of CO2 at 1.8 ppm. Methane levels in the atmosphere have risen for the first time since 1998. This increase was attributed to changes in the permafrost stores of methane.

According to this group if we need to suppress temperature quickly in order to preserve glaciers, reducing methane can make an immediate impact. Compared to the massive requirements necessary to reduce CO2, cutting methane requires only modest investment. This group argues that where they stop methane emissions, cooling follows within a decade, not centuries. Methane amelioration would require non-point source regulation and activity. Methane (CH4) is emitted from a variety of both human-related and natural sources. Methane comes from a variety of sources: landfills, sewage streams, coal mines, oil and gas drilling operations, agricultural wastes, and cattle farms. In the United States, the largest methane emissions come from the decomposition of wastes in landfills, enteric fermentation in ruminant digestion and manure management associated with domestic livestock, natural gas and oil systems, and coal mining. Enteric fermentation occurs when methane (CH4) is produced in the rumen as microbial fermentation takes place. Most of the CH4 byproduct is belched by the animal; however, a small percentage of CH4 is also produced in the large intestine and passed out as gas.

According to the US EPA the largest emitters of Methane in the United States in 2007 was enteric fermentation. I kid you not, belching and (please excuse me) farting animals.

U.S. Methane Emissions by Source (TgCO2 Equivalents)

Source Category 2007
Enteric Fermentation 139.0
Landfills 132.9
Natural Gas Systems 104.7
Coal Mining 57.6
Manure Management 44.0

The Global Methane Fund, does not address the release of methane from the permafrost. In an Opinion piece in the Wall Street Journal Mr. Watson and Mr. Mohamed El-Ashry state “experience has shown that even with modest incentives, methane projects, which are typically small scale, can move fast.” These two gentlemen suggest the creation of a global fund. It won’t work. Methane results from human, animal and plant waste. Landfills are prodigious methane generators and because they are a point source can easily be harvested to produce biogas electricity. The release of methane from the permafrost is not even considered. Though the model for causation is not worked out nor proven, it is argued that un-combusted methane released into the atmosphere is a powerful greenhouse gas and 10% of our nation's impact on the climate comes from the food refuse that ends up decomposing under landfill, and another 10% comes from the gaseous releases of enteric fermentation.

In a New York Times article by Leslie Kaufman, “Greening the Herds: A New Diet to Cap Gas.” Cow that had their grain feed adjusted to include more plants like alfalfa and flaxseed and less corn produce less methane. This feed is more like the natural grasses that the cows evolved eating. The methane output dropped 18-30% depending on the original feed mix while milk production remained stable. In addition to producing less methane, the cows were observed to be healthier. This study evolved out of research performed by the makers of Danon yogurt in France. Scientists working with Groupe Danone had been studying why their cows were healthier and produced more milk in the spring. The answer, the scientists determined, was that spring grasses are high in Omega-3 fatty acids, which may help the cow’s digestive tract operate smoothly.
.
Corn and soy, the feed that became dominant feed in the agro-industrial dairy industry, has a completely different type of fatty acid structure. As was carefully chronicled in Michael Pollan’s book “The Omnivore’s Dilemma” during the past 40 years, our agricultural economy as orchestrated by the Department of Agriculture has created a system of fattening cows using an unnatural feed, corn and soy. Cows are healthier and belch less methane if they are feed a diet similar to one they evolved to eat. This should not be surprising and is a small example of unintended consequences of man trying to bend the earth to our will. Our tools to impact and change remain far more powerful than our wisdom to know the right course of action to take with them. We would be far better off if we could restrain ourselves from wide sweeping actions and $100 billion global investment funds and dip our toes in first to see the results. Try to develop wisdom before we try to manage the natural cycles of the earth, and instead follow the earth’s lead. Concentrate our global funds on teaching sustainable farming, sanitation, and providing fresh water .